flowchart LR
  SS[Space syntax<br/>layout only]:::data --> CMP{Compare<br/>street by street}:::test
  SIM[Imagined walkers<br/>S9]:::step --> CMP
  REAL[Real counts<br/>Ville de Montréal]:::data --> CMP
  PLAY[Player traces<br/>in the game]:::step --> CMP
  CMP --> Q[Where layout accounts for movement,<br/>and where something else does]:::out
  classDef data fill:none,stroke:#8a8a8a,color:#e6e6e6
  classDef step fill:none,stroke:#e6e6e6,color:#e6e6e6
  classDef out fill:none,stroke:#e6e6e6,stroke-width:2px,color:#ffffff
  classDef test fill:none,stroke:#fe83cc,color:#fe83cc
What space syntax is
Where it comes from
Space syntax began with Bill Hillier and Julienne Hanson at University College London. Their book The Social Logic of Space (1984) argued that the arrangement of spaces carries social meaning and can be measured. Applied to a city, the method asks two questions about every street: how easy it is to reach from everywhere else, and how often it lies on the way between other places.
It looks at the shape of the network and nothing else. I find that limit useful, because it lets me ask how much of Griffintown’s movement the layout alone can explain.
Segments and depth
The unit is the segment, a piece of street between two junctions, as in S1 Streets. Depth is the distance between two segments, counted in angles: a right angle costs 1 and a 45° turn costs 0.5 (Turner 2007, p. 542). Hillier and Iida (2005) found that counting turns matched observed movement better than counting metres. Turner also showed that ordinary street centrelines can be analysed this way, so I can use the city’s own street file.
Integration and choice
Integration measures how close a segment is, on average, to every other segment: a street with high integration is easy to get to. Network science calls this closeness centrality (Sabidussi 1966).
Choice imagines the shortest route between every pair of segments and counts how many of those routes pass through each one: a street with high choice is often passed through. Network science calls this betweenness centrality (Freeman 1977).
The results also report normalised versions (Hillier, Yang & Turner 2012, pp. 160, 165 and 191). NAIN rescales integration so that networks of different sizes can be compared. NACH does the same for choice and evens out its skew, where a few streets score very high and most score low. The paper gives two versions of NAIN, so I compare numbers only within one (Reading closely).
Natural movement
Hillier, Penn, Hanson, Grajewski and Xu (1993) called their central claim “natural movement”: the shape of the network is a main driver of how many people walk each street. The full references are in Resources.
NoteStill debated
The claim is influential, and its strength varies with place and land use. In the 1993 paper itself, the correlation between integration and movement across ten parts of King’s Cross ranged from 0.25 to 0.80, and shops could multiply movement beyond what the layout predicts (Hillier et al. 1993, pp. 31, 46). Ratti (2004, p. 492) adds that results depend on how the map is drawn and that the method leaves land use out. So in Situ the claim is something I test in Griffintown.
Radius
The analysis can be limited to a distance around each segment, called the radius. At 400 m it asks how central a street is within about five minutes’ walk; radius n has no limit, which here means the whole island. Studies usually take 400 to 800 m as the low radius and 4,000 to 8,000 m as the high one (van Nes & Yamu 2021, p. 65). My analysis uses 200, 400 and 800 m and radius n for walking, and 1200 and 2000 m for driving. A street can be central at 400 m and peripheral at radius n, and that contrast often tells me more than any single value.
A made-up town
I invented this town so the numbers can be checked by hand, with depth counted as one step per change of street. It has a main street (M1 to M5), cross streets to the north and south, a back street (B1, B2) and a cul-de-sac (C1, C2).
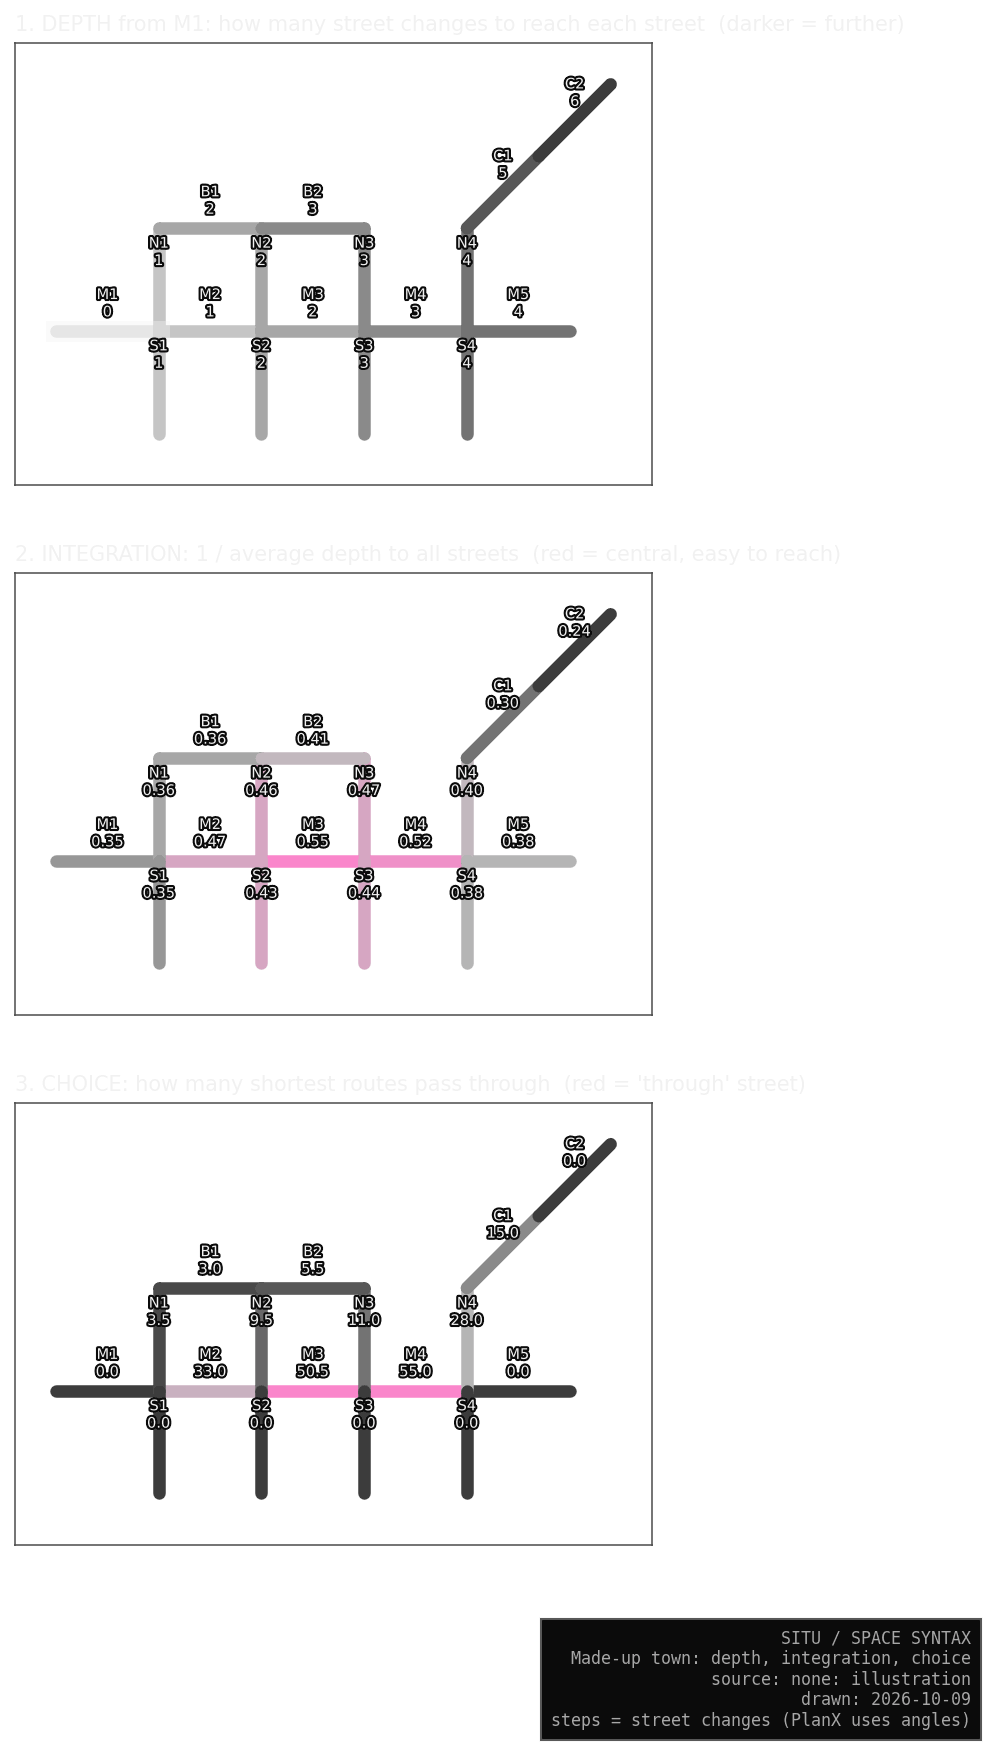
Starting from M1 at depth 0, every street one step away has depth 1, the next ones depth 2, and so on. C2, at the end of the cul-de-sac, is six steps away.
M3 has the highest integration (0.55), because it sits in the middle. C2 has the lowest (0.24), because every other street is far from it.
M4 has the highest choice (55), because routes from the west side to the east side and to the cul-de-sac must cross it. C1 has 15, since every route to C2 passes through it. A dead end like C2 scores 0.
TipWhat the toy shows
M3 is the best place to be, and M4 is the best place to pass through. The two measures differ, so I keep both.
What it leaves out
| Left out | In Griffintown |
|---|---|
| what is on the street | a metro exit, a grocery store |
| height and level | stairs, the canal banks |
| quality of the walk | sidewalk width, trees, noise, snow |
| time | morning and evening, summer and winter |
| traffic rules | one-way streets, closed crossings |
| who is walking | age and purpose |
In Situ each of these belongs to another system, such as S3 Rules or S5 Rhythm. That keeps space syntax clean enough to serve as a measuring stick for the rest.
Why I use it
A measuring stick
My agents never read space syntax values. I compare their movement with the values afterwards, so the comparison is a real test. Agents that preferred high-scoring streets would make it circular: the answer would go in and come back out.
Choice is already a route model built on the least-turning route between every pair of segments (Turner 2007, p. 544). Walkers who took those routes, spread evenly over all pairs, would match choice by construction, and the match would prove nothing. So the walkers S9 imagines pick routes for their own reasons, such as where they are going and the time of day. Space syntax enters Situ only at the end, in S9 Observer.
What the comparison can show
Where the walkers and choice agree, the layout alone may explain the movement. Where they disagree, something else is at work, such as a building or a rule.
The city’s movement counts check the model against reality, and they are thin: seven S1 junctions, one to three days each, between February 2024 and May 2026. Enough to raise a warning, too little to prove anything.
In the game I can watch whether players drift toward integrated streets, which bears on my research question about wayfinding.
Why this method
It runs in QGIS on the city’s open street file, and the same file with the same settings gives the same values. Forty years of studies use it, so I can set Griffintown beside other cities. It was built to study how layout and social life relate, the subject of my research. Its blind spots are well documented, and each one falls to another Situ system.
What this means for my data
Values belong to the network they were calculated on. A missing path makes its neighbours look less connected than they are, so I added the city’s off-street paths before the analysis (The walking network).
The edge of the map also distorts: streets near it look peripheral only because the map stops there (Ratti 2004, p. 496; van Nes & Yamu 2021, p. 51). So the analysis covers the whole island, and I cut Griffintown out of the results afterwards.