S8 Views
What S8 does
S8 says what a person standing on a walkable street can see, measured on the open map. Every 10 m along each walkable S1 street inside the area, it sends 360 sight lines out until each one meets a building outline or reaches 300 m. The shape they enclose is an isovist, the part of the city visible from one point (Benedikt 1979). S8 gives each viewpoint its area, the longest and the mean sight line, and how compact the shape is, and each street the mean of its viewpoints.
S8 measures and imagines nothing. Who looks, and what an open or closed view does to a walk, belong to S9. Like S7, S8 reads neither the city’s counts nor space syntax, so that S9 can compare with both.
What it found
1,798 viewpoints · median area seen 32,000 m² · 9,500 to 109,000 m² for the middle 80 %
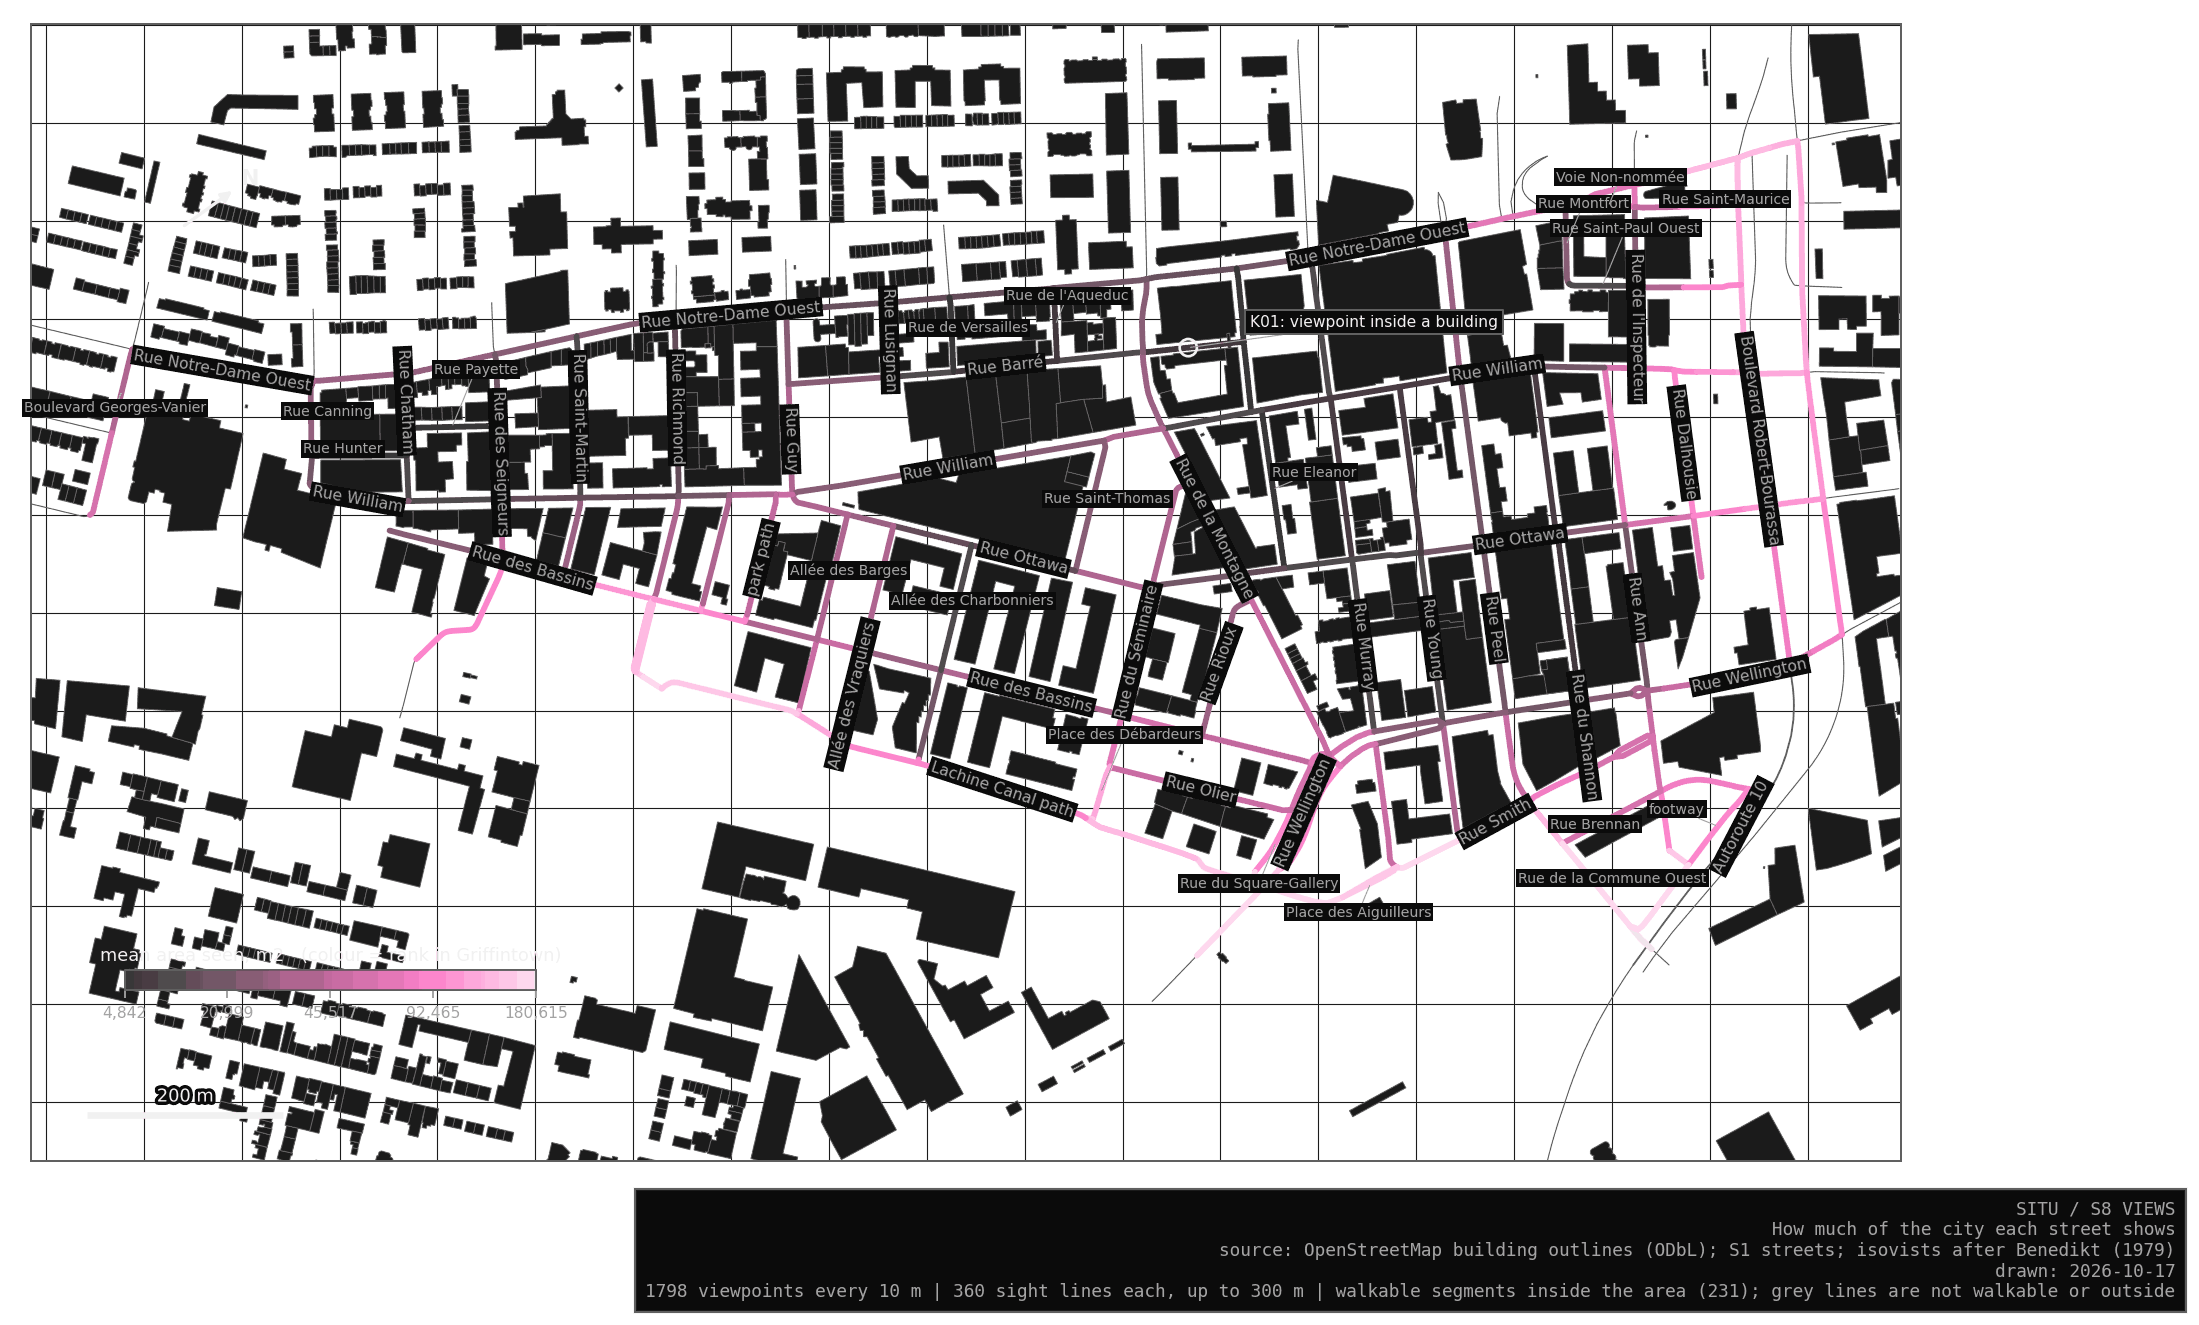
The views split the neighbourhood in two (certain, for the map S8 reads). The small streets of the old grid, Eleanor, du Shannon, Barré, Murray and Young, see between 5,000 and 13,000 m² from a typical viewpoint. The edge along the canal, Rue Smith and Boulevard Robert-Bourassa see between 90,000 and 115,000 m². Rue Wellington, Rue Ann and Rue des Bassins sit in between, at about 50,000 m².
Almost every view is a corridor. From 95 % of the viewpoints at least one sight line runs the full 300 m, along the street itself, and the median compactness is 0.10, where a circle would give 1. The canal path is the most rounded at about 0.2, because the water opens the view sideways.
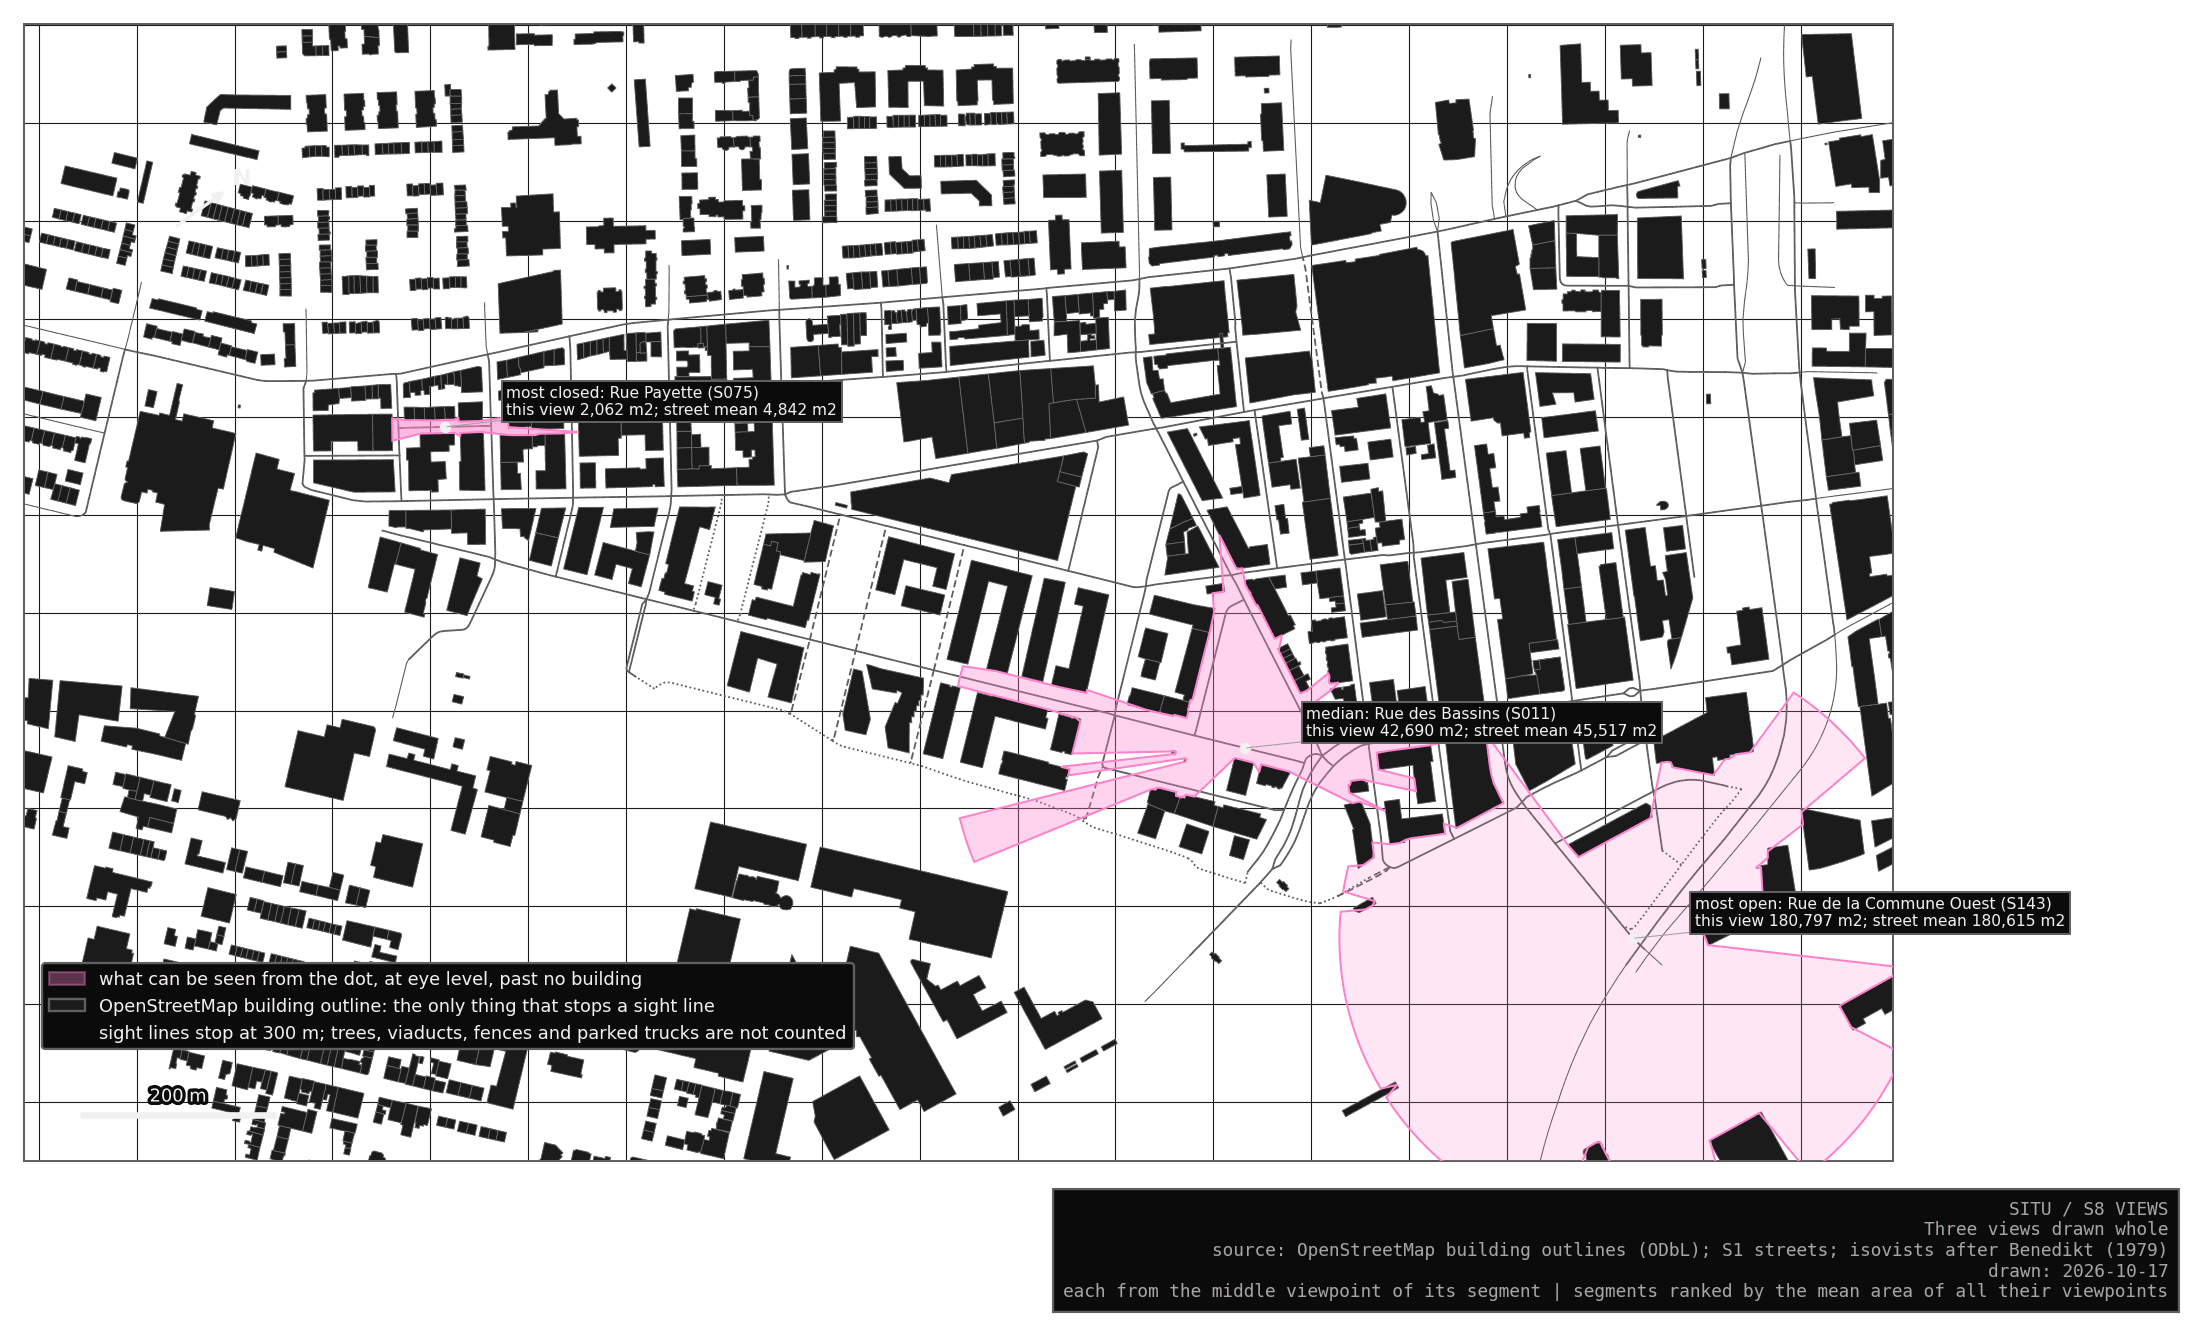
A street’s mean hides how its view changes as one walks. On 49 of the 231 segments, the most open viewpoint sees more than three times the closest one, usually where the street crosses another or passes an empty lot.
My reading, and it is an interpretation: the old grid keeps the narrow, long views of a nineteenth-century working district, and the redevelopment along the canal opened wide views towards the water and the expressways. Whether people walk differently through the two is a question for S9 and the counts.
What it rests on
Only the building outlines of OpenStreetMap stop a sight line. Trees, fences, parked trucks and the rail and expressway structures at the south-east corner are not in that file, so they stop nothing, and the views there are wider than a person would see (likely). Trees are left out on purpose: the city records their trunks, and nothing open says how wide their crowns are today. The view is flat, at eye level, with no height: a low wall and a tower block a sight line the same way.
A building missing from OpenStreetMap opens a view that does not exist. The stress test left out one outline in ten at random: the median area seen grew by 13 to 78 %, and in each draw one street saw between three and nearly eight times as much. The order of the streets held better (rank correlation 0.90 to 0.99). So I trust the order of the streets more than any single area (likely).
The 300 m reach is a choice. With 100 m or 500 m the areas change a lot, while the order of the streets stays close (0.95 and 0.99).
Checkpoints
One. On Rue Barré (S006), a viewpoint falls inside a building outline, where the street probably passes under a building or the outline is drawn over it. Its view is measured from inside the outline, so it is close to zero and pulls the street’s mean down.
In the Lab
In the Lab, the Views tab colours every walkable street by the area seen, the longest sight line or the compactness. Click a street to draw the view from its middle viewpoint and read its measures.