S7 Commuters
What S7 does
S7 says, from the open data, who commutes from Griffintown and to it on an ordinary weekday: how many residents of each building go out to work, how they travel, at what hour they leave, and how far each home is from the metro and the bus along the S1 streets. For the people who come here to work, it gives how they come and when they arrive.
S7 draws no walk. Where each person goes, by which street, and when they come back are not in any open file, and imagining them belongs to S9, which will tell the neighbourhood’s story from all the systems. S7 also reads neither the city’s counts nor space syntax, so that S9 can compare with them. What a walker can see from the street is S8.
What it found
about 7,200 residents commute · a quarter on foot · 71 % of homes are more than 800 m from a metro entrance
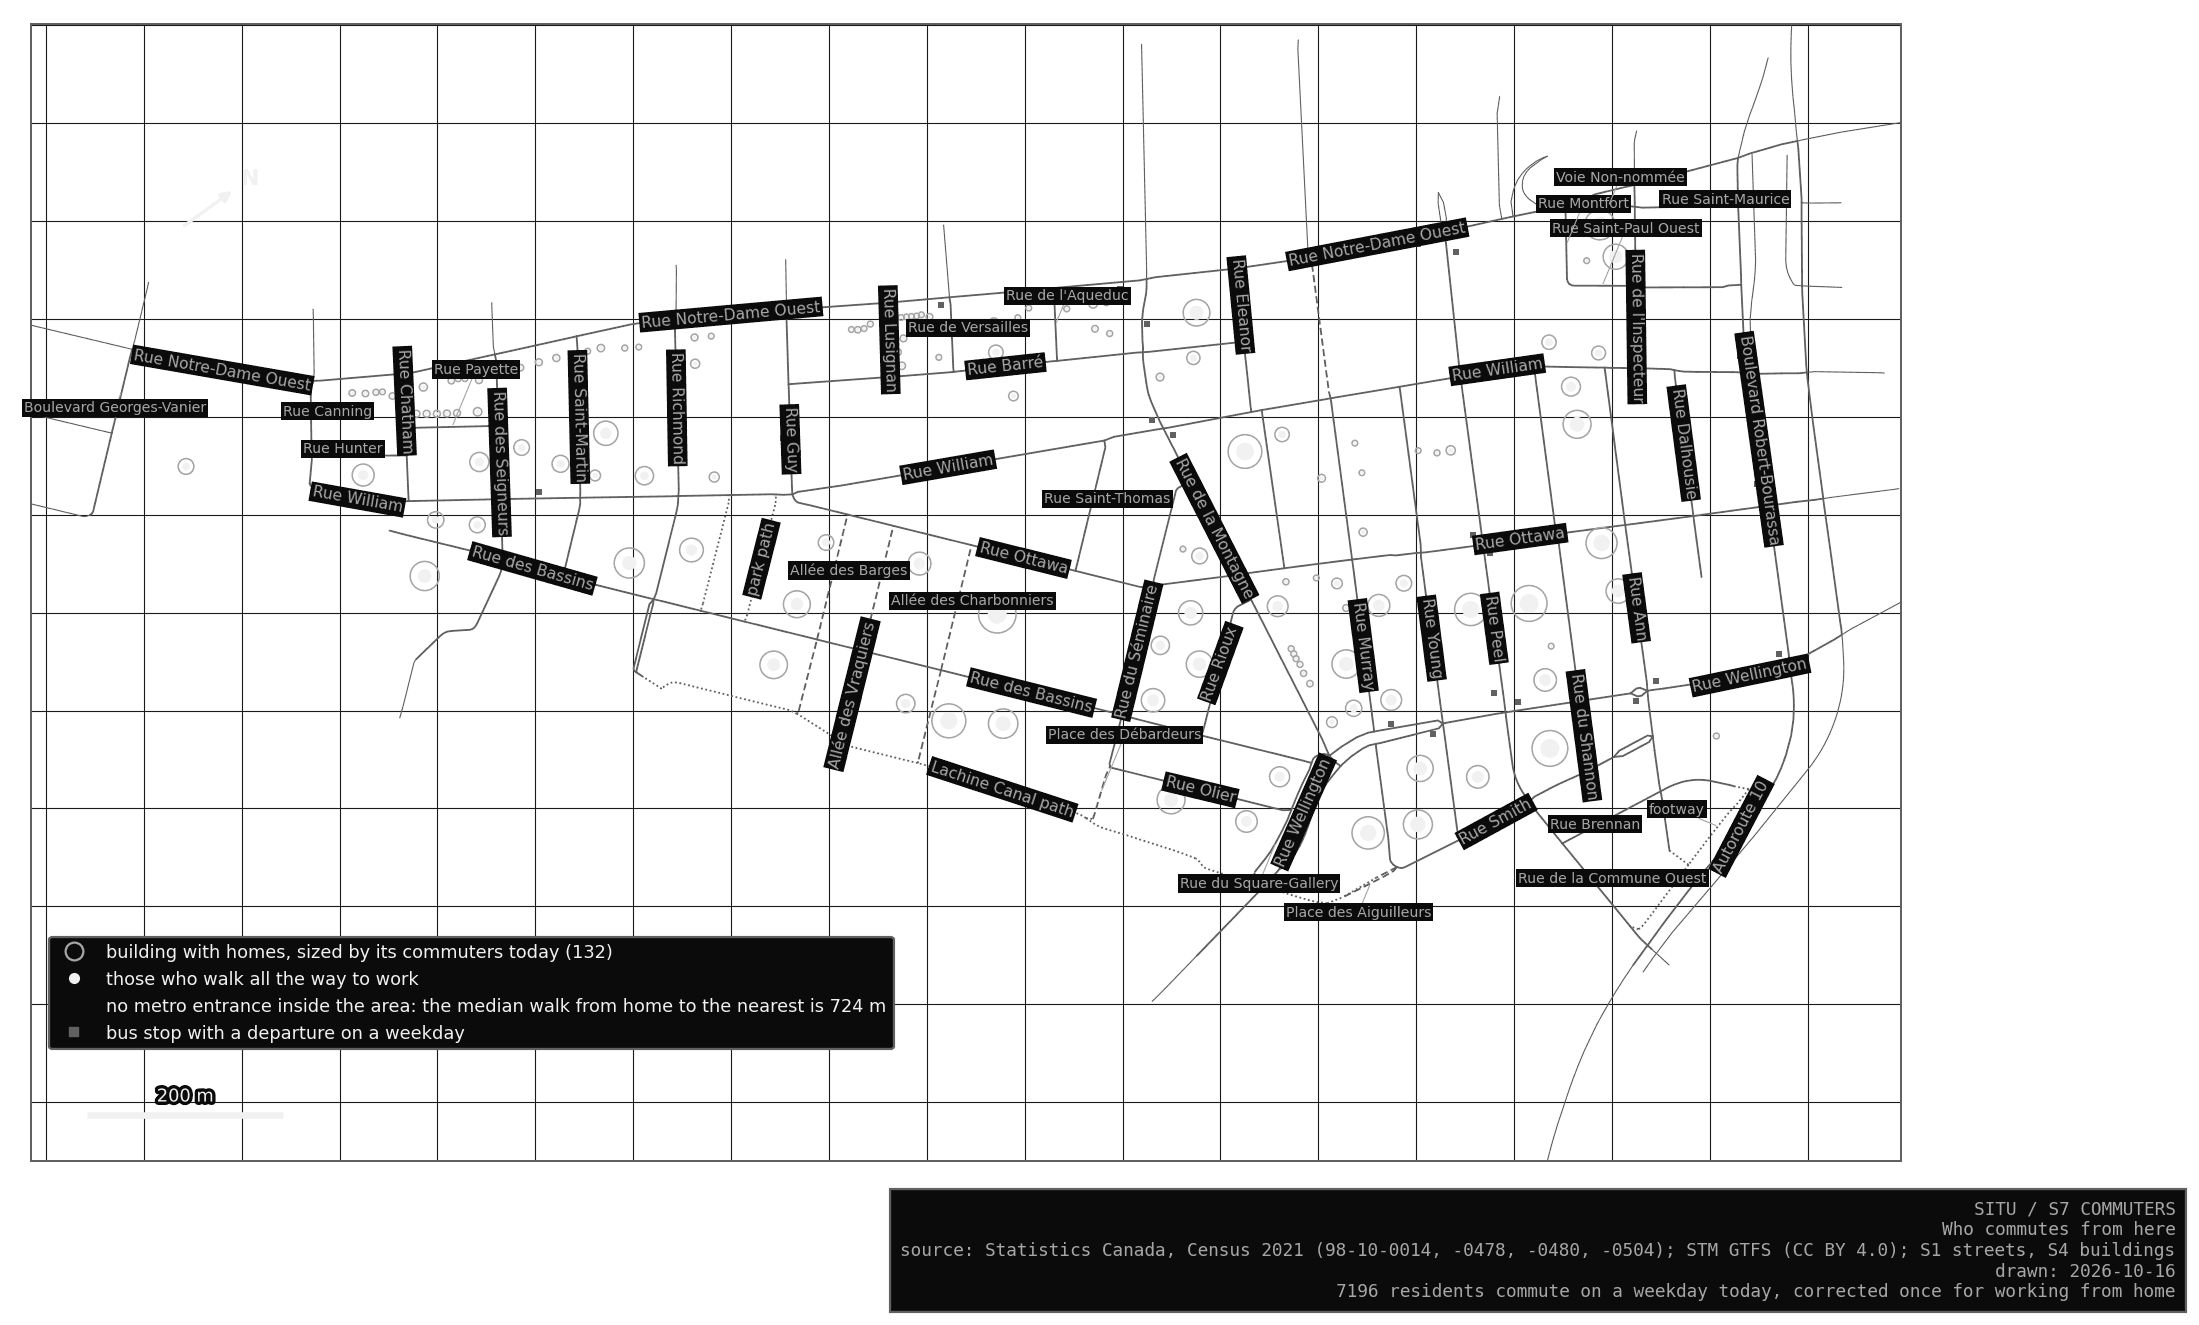
The 11,954 homes in S4 send about 7,200 residents out to work on a weekday. About a quarter walk all the way, a fifth take the metro or a bus, and close to half drive (likely, for the reasons under What it rests on). Most leave between 7 and 9 in the morning.
No metro entrance stands inside the area. Half of the homes are more than 940 m from the nearest one along the streets, and 71 % are more than 800 m away, while no home is more than about 400 m from a bus stop (certain, for the streets of S1). Bonaventure is the nearest metro for half of the homes, Lucien-L’Allier for a third and Georges-Vanier for the rest.
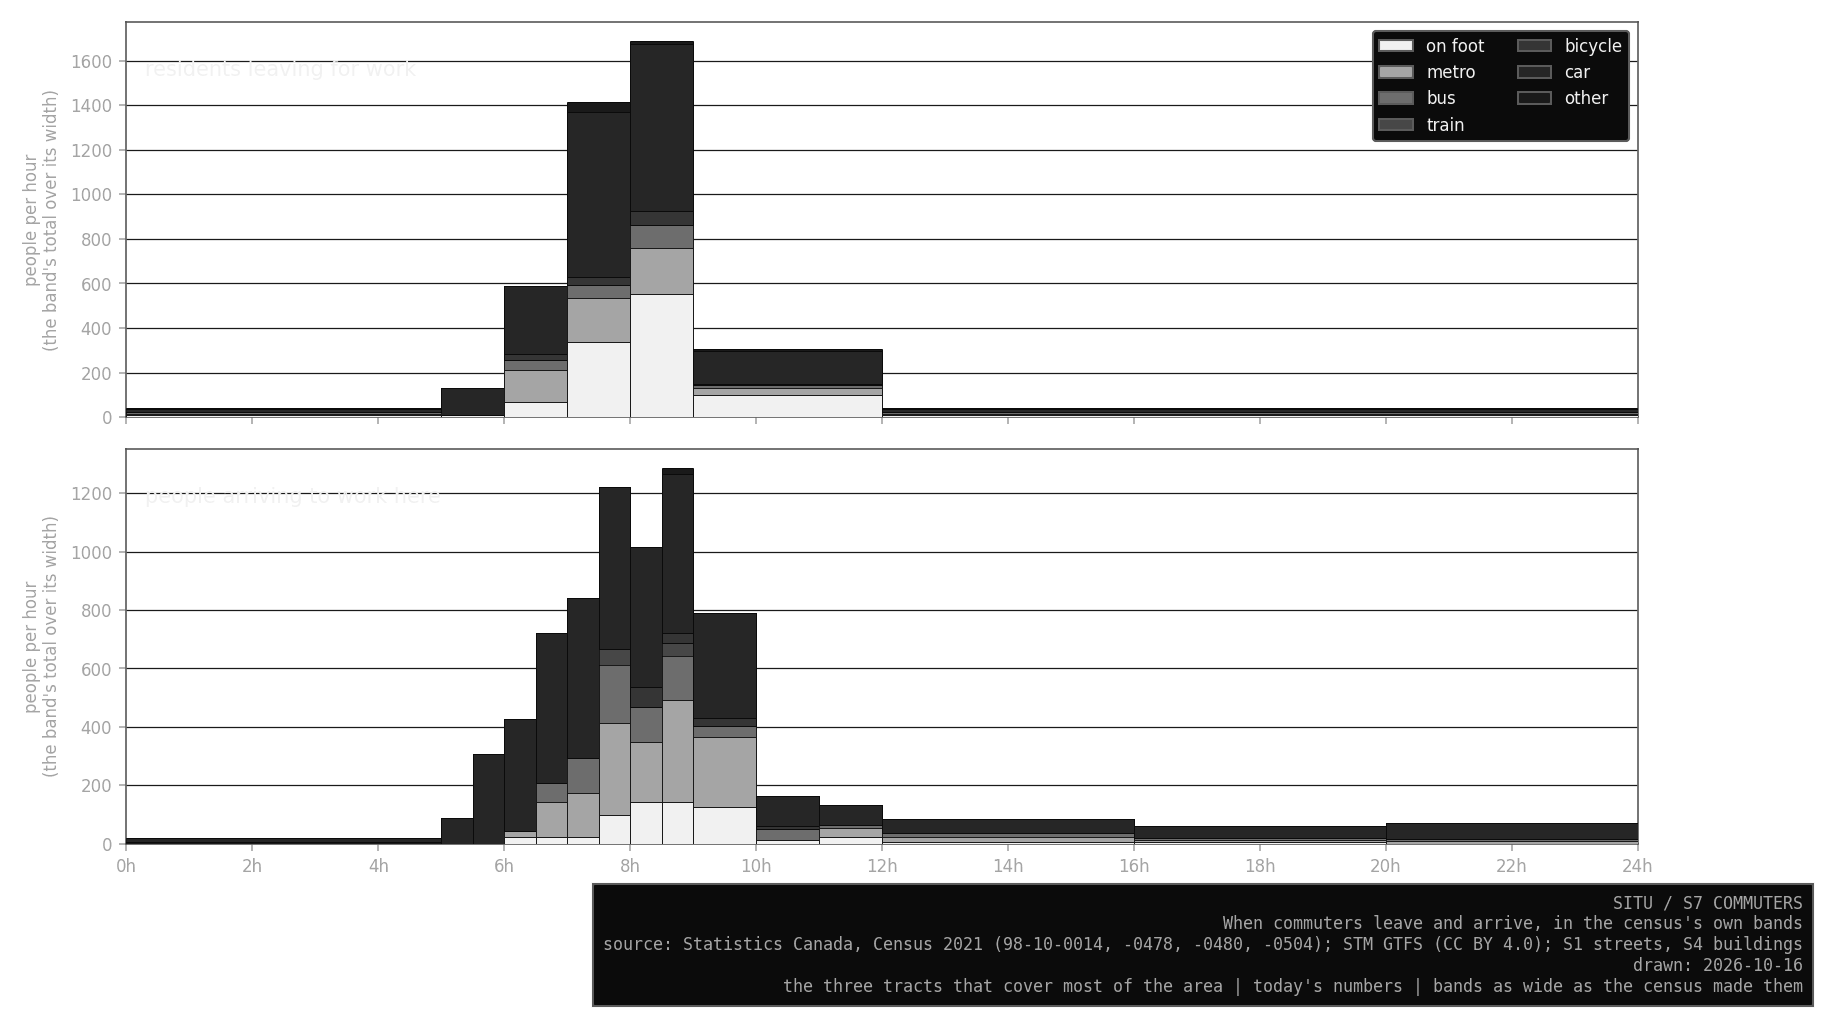
About 5,000 people work in the three tracts that cover most of the area. Close to 60 % of them come by car, a fifth by metro and fewer than one in ten on foot. They arrive a little later than the residents leave, most of them between 7:30 and 10.
My reading, and it is an interpretation: Griffintown’s residents walk to work far more than the people who work here, and its homes are close to buses and far from the metro. The neighbourhood seems to send walkers out and receive drivers in.
What it rests on
The census of May 2021 is the only open source that says, tract by tract, when people leave for work, when they arrive and how they travel (certain). Its week fell during the pandemic, and 42 to 56 % of the employed residents of the three tracts worked from home. Across Canada, working from home fell from 24 % in that week to 17 % in May 2025. S7 applies that fall to each tract once, so a tract where 55 % worked from home now counts about 39 %. That is its one correction, and every number of commuters moves with it; the stress test shows by how much. The shares by mode and by hour stay the census’s own.
In 2021 people probably avoided transit, so the shares by mode probably give the car too much today (likely). The 2026 census should replace all of this, but its commuting results will likely come out after this prototype ends.
The number of homes is today’s, from the tax roll in S4, so the towers built since 2021 are counted.
Checkpoints
None: every building with homes lies in a tract where people lived at the 2021 census.
In the Lab
In the Lab, the S7 tab draws every building with homes, sized by its commuters: all of them, those on foot, by transit or by car. Click one for its commuters by mode and its walk to the nearest metro entrance and bus stop. The side lists the census’s hour bands.