Movement counts and light timing
What the city counted
The city counts every car, truck, bus, bicycle and pedestrian at its intersections in 15-minute slices, by movement for vehicles (northbound left, northbound through and so on) and by crosswalk for pedestrians and bicycles. The file covers the whole city, 2024 to 2026 (donnees.montreal.ca).
I kept the counts taken within 15 m of an S1 junction, which leaves seven junctions. A one-day count covers three windows, the two rush hours and two hours at midday, with gaps between them:
| Junction | Where | When | Control in S3 |
|---|---|---|---|
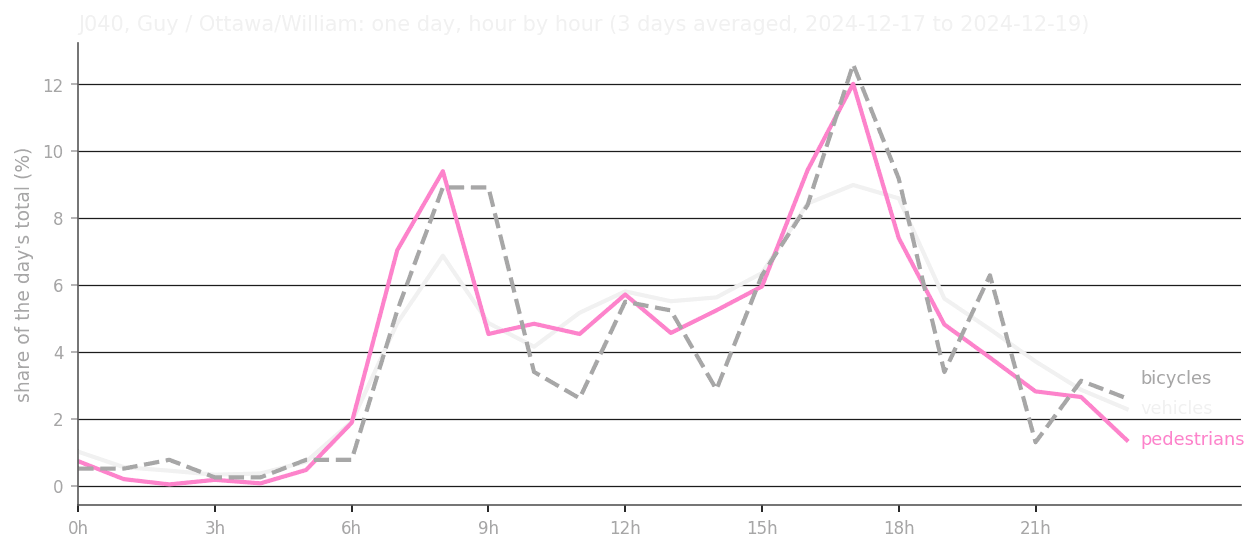
| J040 | Guy, Ottawa and William | 3 days, around the clock, December 2024 | lights |
| J051 | de la Montagne and Notre-Dame | 1 day in three windows, 6:30 to 18:30, May 2026 | lights |
| J181 | Robert-Bourassa and Saint-Jacques | 1 day in three windows, 6:30 to 18:30, November 2024 | lights, at an exit |
| J006 | Ann and Wellington | 1 day in three windows, 6:00 to 18:30, February 2024 | all-way stop |
| J056 | Murray and Wellington | the same day | none |
| J086 | Shannon and Wellington | the same day | stop |
| J092 | Young and Wellington | the same day | stop |
Beyond the lights, these counts serve two later systems. S9 compares simulated movement with space syntax, the measures of how each street sits in the whole network, and also, at these junctions, with movement actually counted. J040, counted around the clock, gives S5 Rhythm its measured day, which no system builds from, so S9 can compare with it. The one exception is below: the counts at J040 and J051 set those two lights, so S9 will not use them to judge the cars there.
Estimating the lights with Webster’s method
S3 knows where the 31 lights in S1 are, but the city does not publish its timing plans, so the timing is my estimate.
Webster’s method (Webster 1958) is the classic way to set a fixed light cycle from counted traffic: it asks how full each approach is, and which cycle length keeps the delay smallest. I apply it to the busiest counted hour. An approach’s load is the cars arriving per hour (a bus or truck counts as two) divided by what its lanes, taken from OpenStreetMap, can pass while green, about 1,800 cars an hour per lane. Each phase takes its fullest approach, and the phases add up to a total load. Webster’s formula turns that load, and the time lost each time the green changes (4 s per phase here), into a cycle length, and each phase gets green in proportion to its load. I add one check Webster does not make: a pedestrian crossing needs at least 7 s to start, plus the time to cross at 1.2 m/s, and a shorter green is lengthened.
The two phases run along the street grid’s north-south, then its east-west, with grid north at about 305° on the compass, as in the city’s counts. At J040 almost nothing arrives from the north, where Ottawa is the one street no car may arrive along, which confirms the orientation.
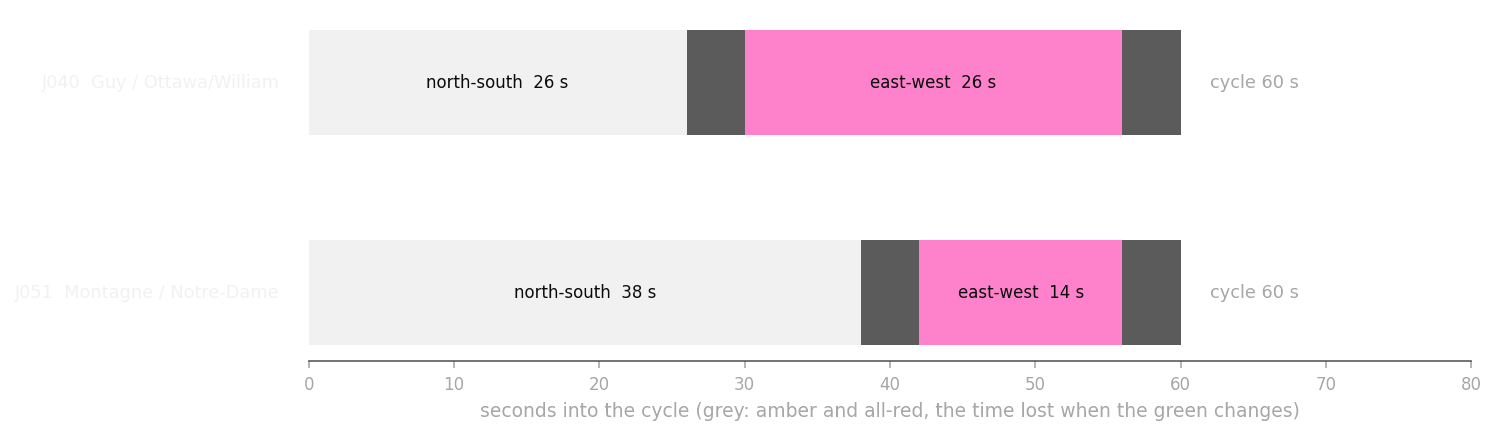
At J040, at 16h on 18 December 2024, the total load was 0.29 and Webster’s cycle came to 24 s. At J051 the load was 0.38 and the cycle 27 s. The traffic is far from filling these lights, and both cycles are much shorter than any city would use, so I use my lower limit of 60 s. The green is then set by pedestrians and by the split of loads: 26 s each way at J040, and 38 s north-south against 14 s east-west at J051. That is a finding about Griffintown’s streets, and a warning: at these volumes traffic leaves the timing open, so it becomes a design choice.
J181, on Robert-Bourassa, is skipped, because three of its four approaches lie beyond the network and Webster needs them all.
The other 29 lights
I weighed four options. One plan for all lights would give a main street and a side street the same green. Borrowing the split of a counted light on the same streets would use real counts, but only two lights were counted. Timing the lights from space syntax was ruled out, because S9 compares movement with space syntax and would end up measuring its own input. I chose to share the green by road class, the city’s own street hierarchy, already in S1.
The city’s 2007 review of its arterial network (PDF) gives each class a daily traffic range: main arteries carry over 30,000 vehicles, collectors 1,000 to 15,000. Managing the flow is “prépondérante” on main arteries and “peu” on collectors (Ville de Montréal 2007). The United States standard agrees: “In general, the higher the traffic volume is, the higher the functional classification will be” (FHWA 2023, p. 26, PDF). Since Webster (1958) shares the green by how full each approach is, a busier street should get more of it.
The counts agree. At all five counted junctions where the two streets differ in class, the higher class carried more traffic over the day: William, a collector, 2.5 times as much as Guy at J040, and Wellington, a secondary arterial, 8.5 to 29 times as much as Ann, Murray, Young and Shannon. Four of the five are on Wellington, so the sample is small.
Road class does not match Webster at the two counted lights. At J040 it would give 21 and 31 s where Webster gives 26 and 26, because at the busiest hour each lane is about as full on both streets. At J051 it would give 26 and 26 s where Webster gives 38 and 14, because the classes are equal but de la Montagne is busier. So class tells which street gets more green over a day, and says nothing of how much at a given hour. The counted lights therefore keep Webster, and the share by class stays a cautious 60 %.
The rule: each street arriving at a light belongs to one of the two axes, and each axis takes the highest class among its streets, from main arterial (with highway) down through secondary arterial and collector to local. If both axes have the same class, the two phases share the 52 s of usable green equally. If not, the higher class gets 60 % and the lower 40 %. No phase is shorter than its pedestrians need, and where they need more, the cycle grows. Where cars arrive on one axis only, the other phase is for pedestrians.
Of the 31 lights, 2 follow Webster from counts, 17 have one street of higher class, 7 have equal classes, and 5 have cars on one axis only, mostly at the edge where the cross street lies beyond the network. In S9 these become the light plans its imagined drivers stop at, with the 60 % share and the 60 s cycle written down as assumptions. The city’s pedestrian-signal file uses the same intersection numbers as its light file: 30 of the 31 lights have pedestrian signals, all but Seigneurs and William.
Assumptions
Two numbers are mine alone. The 60 s lower limit on the cycle (with 120 s as the upper) is my guess for a city centre, and it sets every cycle here. The 60 % share is my own choice too, since the counts show which street is busier and say nothing of the amount. The other values (lane capacity, time lost per phase, walking speed and walk interval) follow Webster or common practice, because Montréal publishes neither its amber and all-red times nor its walking speed. The lane counts from OpenStreetMap cover 866 of 870 car ways, and I checked them at three junctions only.
The counts themselves cover a few days each, in winter or spring. They show those days; a typical year is beyond them.