flowchart TB
  A[/"City streets<br/>Sample 4"/]:::data
  B[/"City bike network"/]:::data
  C[/"Park paths<br/>decision C18"/]:::rule
  M[/"Checked places<br/>M01"/]:::rule

  A --> S0["LEAVE OUT<br/>highways, planned streets"]:::step
  B --> S1["READ PATHS<br/>off-street only,<br/>plus paths under removed highways"]:::step
  C --> S1
  S0 --> S2
  S1 --> S2["DROP DUPLICATES"]:::step
  S2 --> S3["JOIN<br/>path ends, then street dead ends"]:::step
  M --> S3
  S3 --> S4["CUT STREETS<br/>where a connector lands"]:::step
  S4 --> S5["DROP ISLANDS"]:::step
  S5 --> T["SIX CHECKS"]:::test
  T --> O[/"Walking network<br/>with a report and lists"/]:::out

  classDef data fill:none,stroke:#8a8a8a,color:#e6e6e6
  classDef rule fill:none,stroke:#8a8a8a,stroke-dasharray:4 3,color:#a6a6a6
  classDef step fill:none,stroke:#e6e6e6,color:#e6e6e6
  classDef out fill:none,stroke:#e6e6e6,stroke-width:2px,color:#ffffff
  classDef test fill:none,stroke:#fe83cc,color:#fe83cc
The walking network
Why I made it
The city’s street file (Géobase) draws streets and leaves out most paths away from them, including the Lachine Canal path and the park paths in Griffintown. Space syntax, the method I use to measure how each street sits within the whole network (what it is), reads that network all at once (why that matters). So a missing path does double harm: its own place is empty, and the streets around it look less connected than they are.
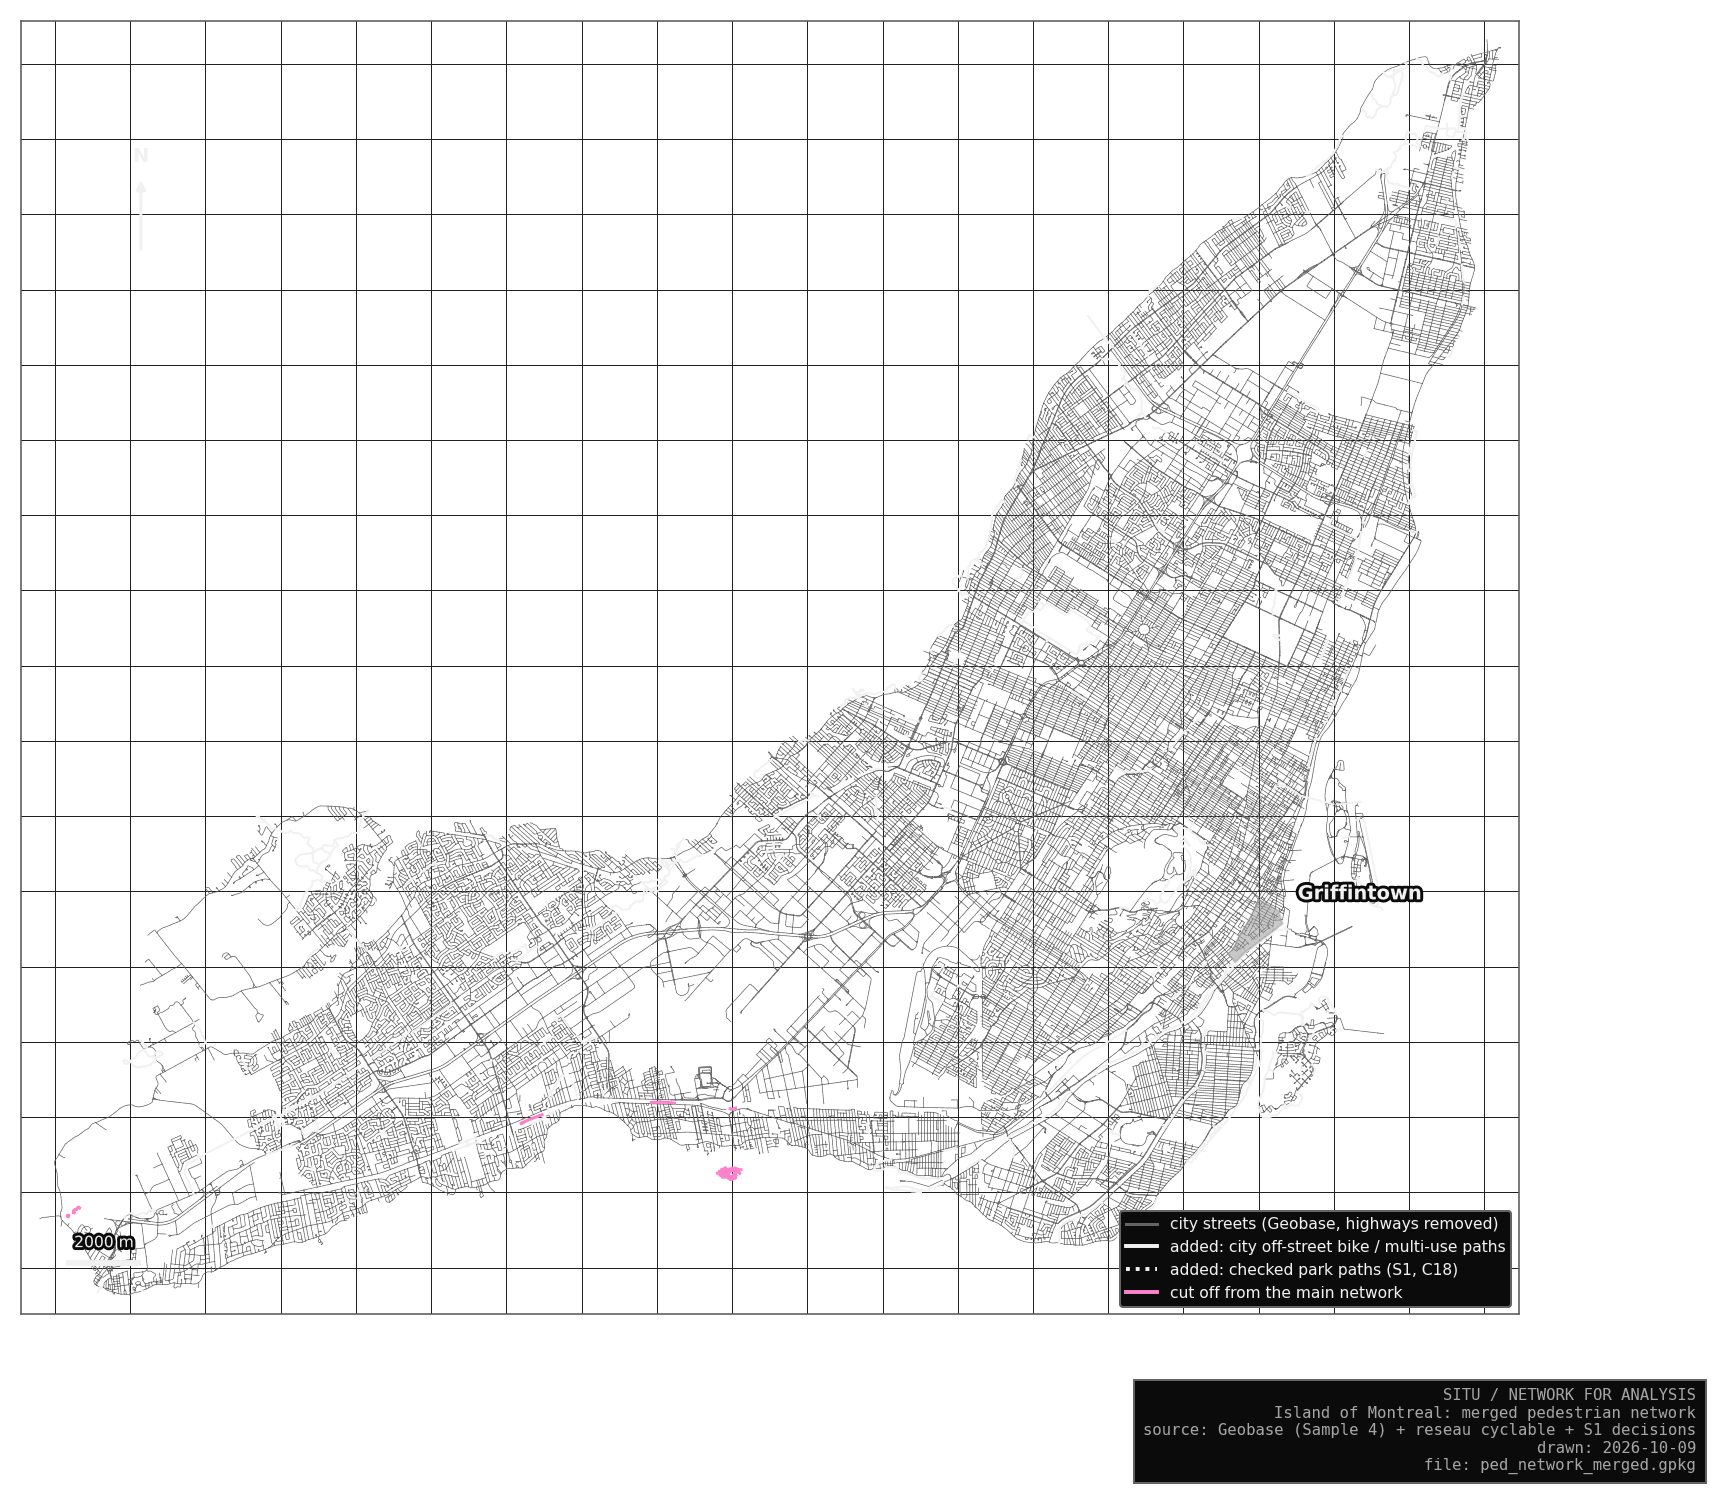
Before running the analysis, I built one walking network for the whole island of Montréal, with the paths people actually use. My earlier analysis files (Sample 4) stay untouched beside it. Cars get their own network.
What changed
Highways come out, because nobody walks on them, and so do streets that exist only as plans. Painted bike lanes and paths lying on top of a street stay out, since the street is already there. Added pieces that join nothing are dropped, because a piece on its own would get meaningless values.
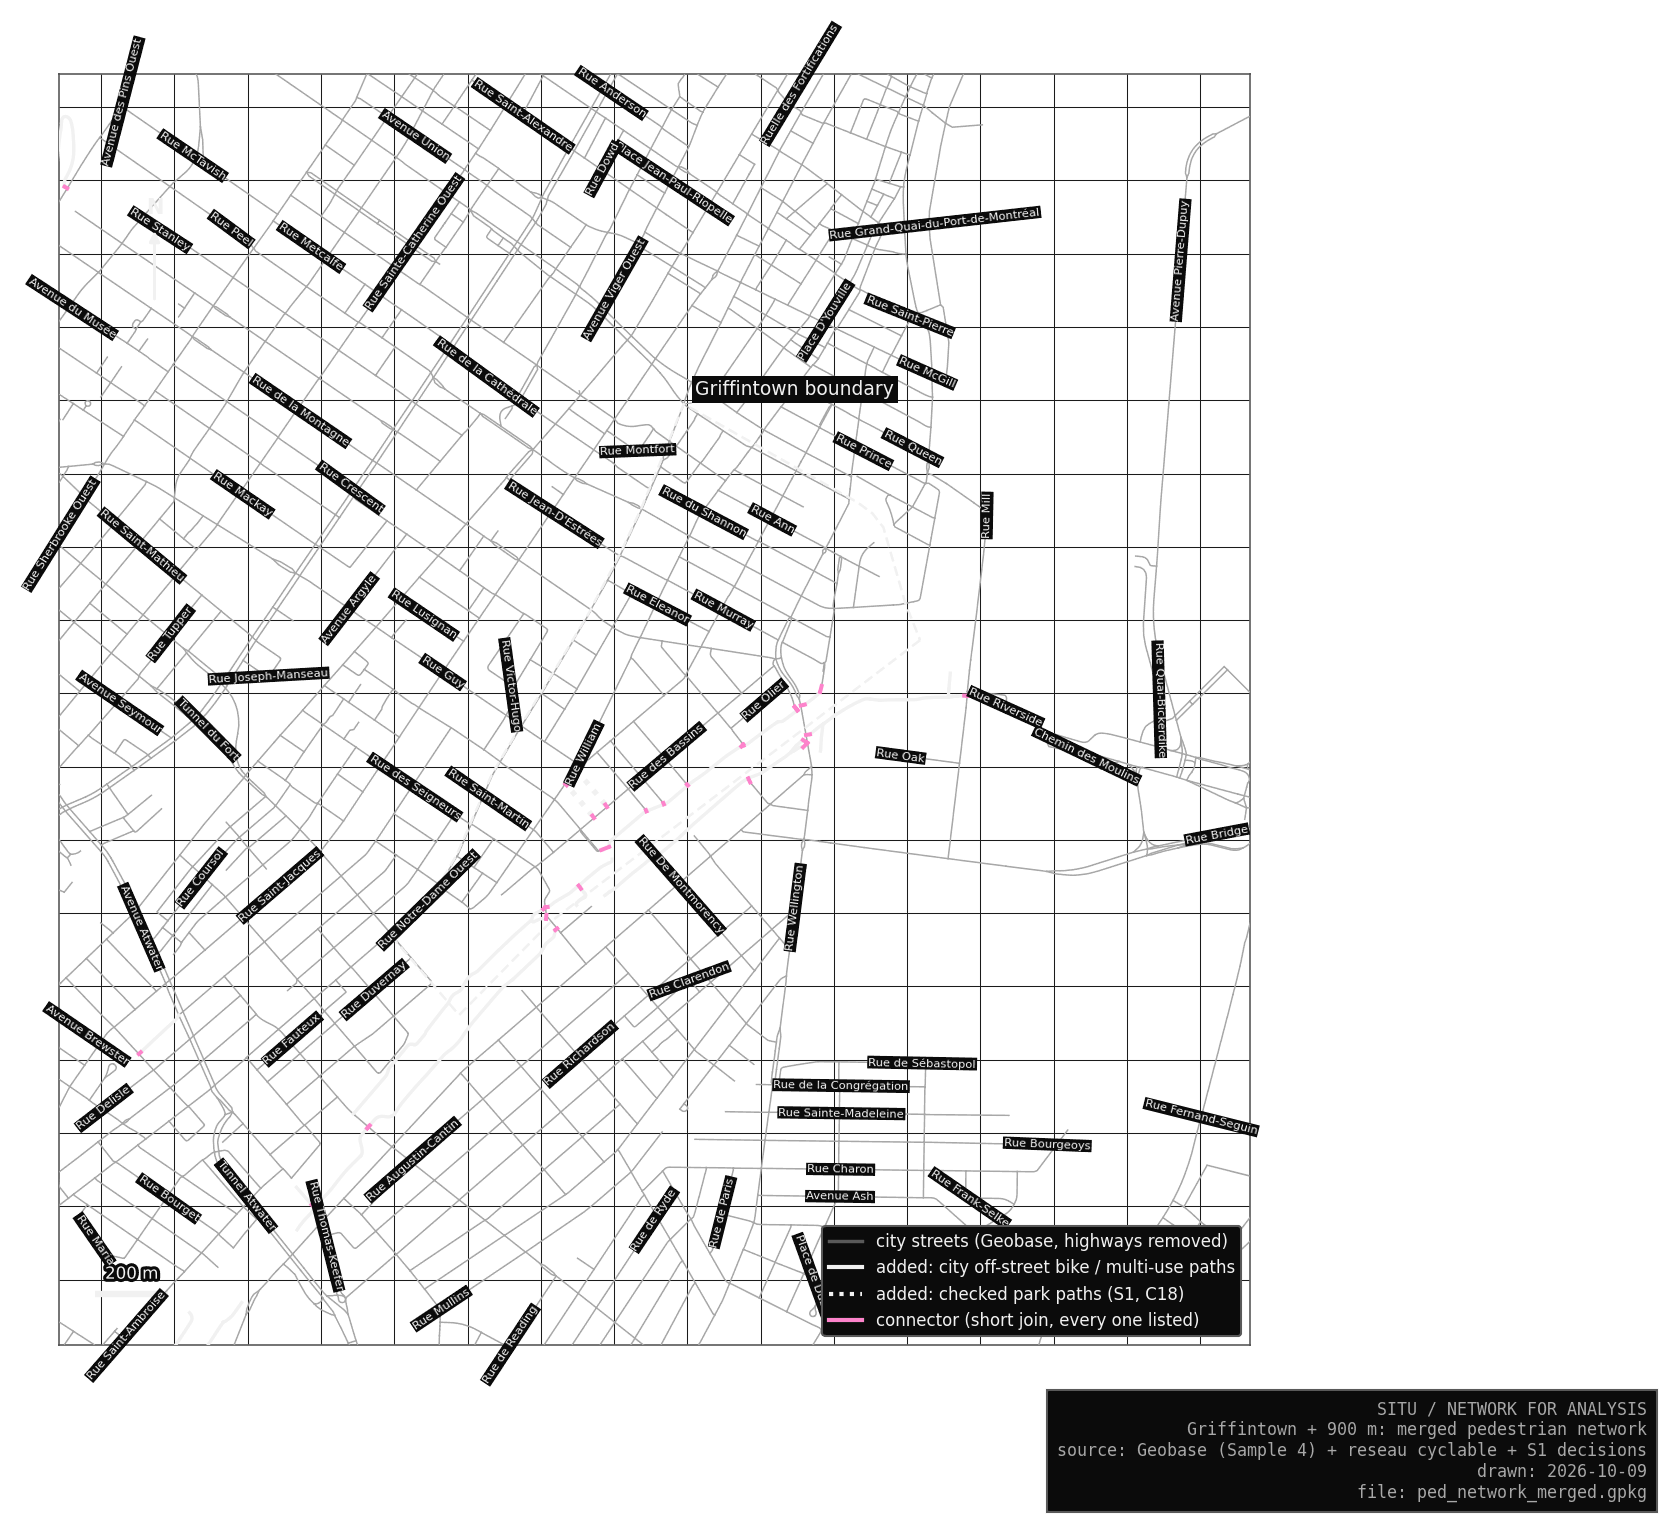
I added the off-street bike and multi-use paths from the city’s bike network, because people walk on them, including the separated paths on bridges that are filed under a highway. I also added the two Griffintown park paths I checked on photos in S1 (decision C18). Where a path end and a street do not quite touch in the data, a short straight line, which I call a connector, joins them. Every connector is listed.
47,197 lines
Of these, 740 are added path pieces, 161 km in all, and 416 are connectors.
The network carries the same October decisions as S1: the footway behind Brennan and Ann (C04), and the link across Place des Aiguilleurs from the end of Smith (C06).
How it is built
NoteEach step in plain words
A path counts as a duplicate when most of its length runs within 10 m of a street. Joining follows the S1 rules: a path end joins the nearest junction or street, and a street dead end may join the middle of a path. The gap may be 15 m across the island, and 25 m in Griffintown and at places I have checked on a photo, because only there have I looked. A path crossing a street with no junction stays unjoined, since it could be a bridge or a tunnel. Where a connector lands mid-street, the street is split there. Last, added pieces cut off from the main network are dropped; city streets never are.
Six checks follow. They confirm that every walkable city street is still there at its full length and that no painted bike lane slipped in. Every connector is within its limit, and Griffintown matches S1. Two checks list what remains to look at: 73 places where an added path crosses a street with no junction, and six small parts cut off from the main network.
A checked place: Île-des-Sœurs
On the first run Île-des-Sœurs was cut off: the bike path from the bridge ends 15.2 m from the boulevard. Raising the limit for the whole island would have created joins everywhere else, so I checked this one place on a photo.
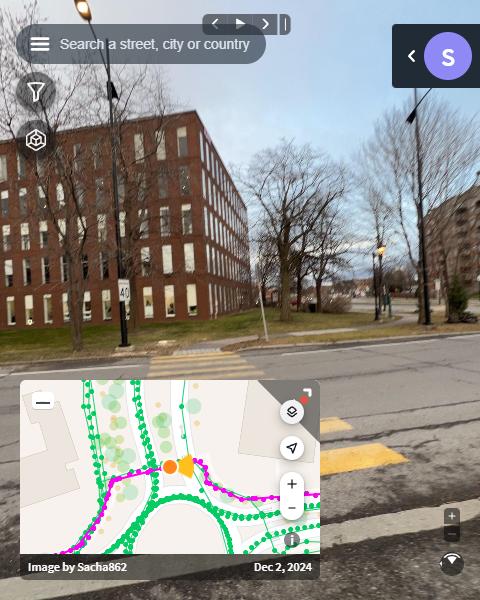
The crossing is real. I recorded it as a checked place (M01), confirmed from the photo, and the longer Griffintown limit now applies near it. Any other gap gets fixed the same way: look, decide, record it, run again.
Maps
Risks
Every added path is a claim about where people can walk, so I want each to carry its evidence, a dated photo, that anyone can dispute. A connector could join two things that are separate in reality, which is why the gaps are short and every connector is listed. A real link could also stay unjoined, and the 73 crossings are listed so I can check them one by one. Near Griffintown the risk is low: one unjoined crossing within 800 m, four within 2 km.
Bike paths stand in for footpaths, and a few may be unpleasant or closed to walking, so I took only separated paths and multi-use trails. The city maps park footpaths less well than bike paths, and I checked only Griffintown on photos, so values far from it are less certain.
The analysis
On 10 October I ran PlanX, the QGIS tool that computes the values, with the Sample 4 pedestrian settings: angular segment analysis at radii of 200, 400 and 800 m and the whole network. Every line kept its number and shape, so S2 can trace each value to one line. The first run that day used a faulty Smith link (C06) that joined Smith to itself (how it was found); the evening rerun, checked line by line, matches the network.
ImportantOld and new values are different measurements
These values come from a different network, so they are a new measurement that replaces the Sample 4 pedestrian values. I keep both and say which one each figure uses.
The driving network
The vehicle network starts from every city line and leaves out the lines cars may not use under the S1 road classes, plus one small group of streets no car can reach. The rest stay exactly as the city drew them, highways included. Segment analysis reads every line as two-way, though one-way streets keep their direction in the data. I ran PlanX on it on 10 October, at radii of 1200 and 2000 m. The Sample 4 vehicle values came from a network with pedestrian ways in it; now no segment closed to cars carries a vehicle value (S2).