flowchart TB
  IN1[/"S1 segments<br/>264 segments"/]:::data
  IN2[/"Walking values<br/>47,197 analysed lines"/]:::data
  IN3[/"Vehicle values<br/>47,730 analysed lines"/]:::data
  CFG[/"Settings<br/>a test point every metre, within 1 m<br/>cover 95 % or 50 %"/]:::rule

  IN1 --> R["READ<br/>segments and analysed lines"]:::step
  IN2 --> R
  IN3 --> R
  R --> G["SORT<br/>walking lines into a 20 m grid"]:::step
  G --> W["WALKING MATCH<br/>test points and the same-kind rule,<br/>cover and a mean by length"]:::step
  CFG --> W
  R --> V["VEHICLE MATCH<br/>may cars use it, then the same street"]:::step
  W --> S["STATUS<br/>matched, split,<br/>partial or missing"]:::step
  V --> S
  S --> O1[/"values for every segment"/]:::out
  S --> O2[/"trace of every line used"/]:::out
  O1 --> T["checks"]:::test
  O2 --> T
  T --> X["stress tests"]:::test
  X --> VZ["maps"]:::test
  VZ --> WB["data for the Lab"]:::test

  classDef data fill:none,stroke:#8a8a8a,color:#e6e6e6
  classDef rule fill:none,stroke:#8a8a8a,stroke-dasharray:4 3,color:#a6a6a6
  classDef step fill:none,stroke:#e6e6e6,color:#e6e6e6
  classDef out fill:none,stroke:#e6e6e6,stroke-width:2px,color:#ffffff
  classDef test fill:none,stroke:#fe83cc,color:#fe83cc
S2 Scores
What S2 does
S2 attaches space syntax values to every S1 segment and records the analysed line behind each value. Space syntax, begun by Bill Hillier and Julienne Hanson at University College London, measures where each street sits in the whole street network (what space syntax is). Integration is roughly how easy a street is to reach. Choice is roughly how often it lies on the way between other places. Both are measured within a radius, from 200 m up to the whole island.
S3 to S8 never read these values. Only S9 Observer uses them, at the very end, as a measuring stick (why).
Result
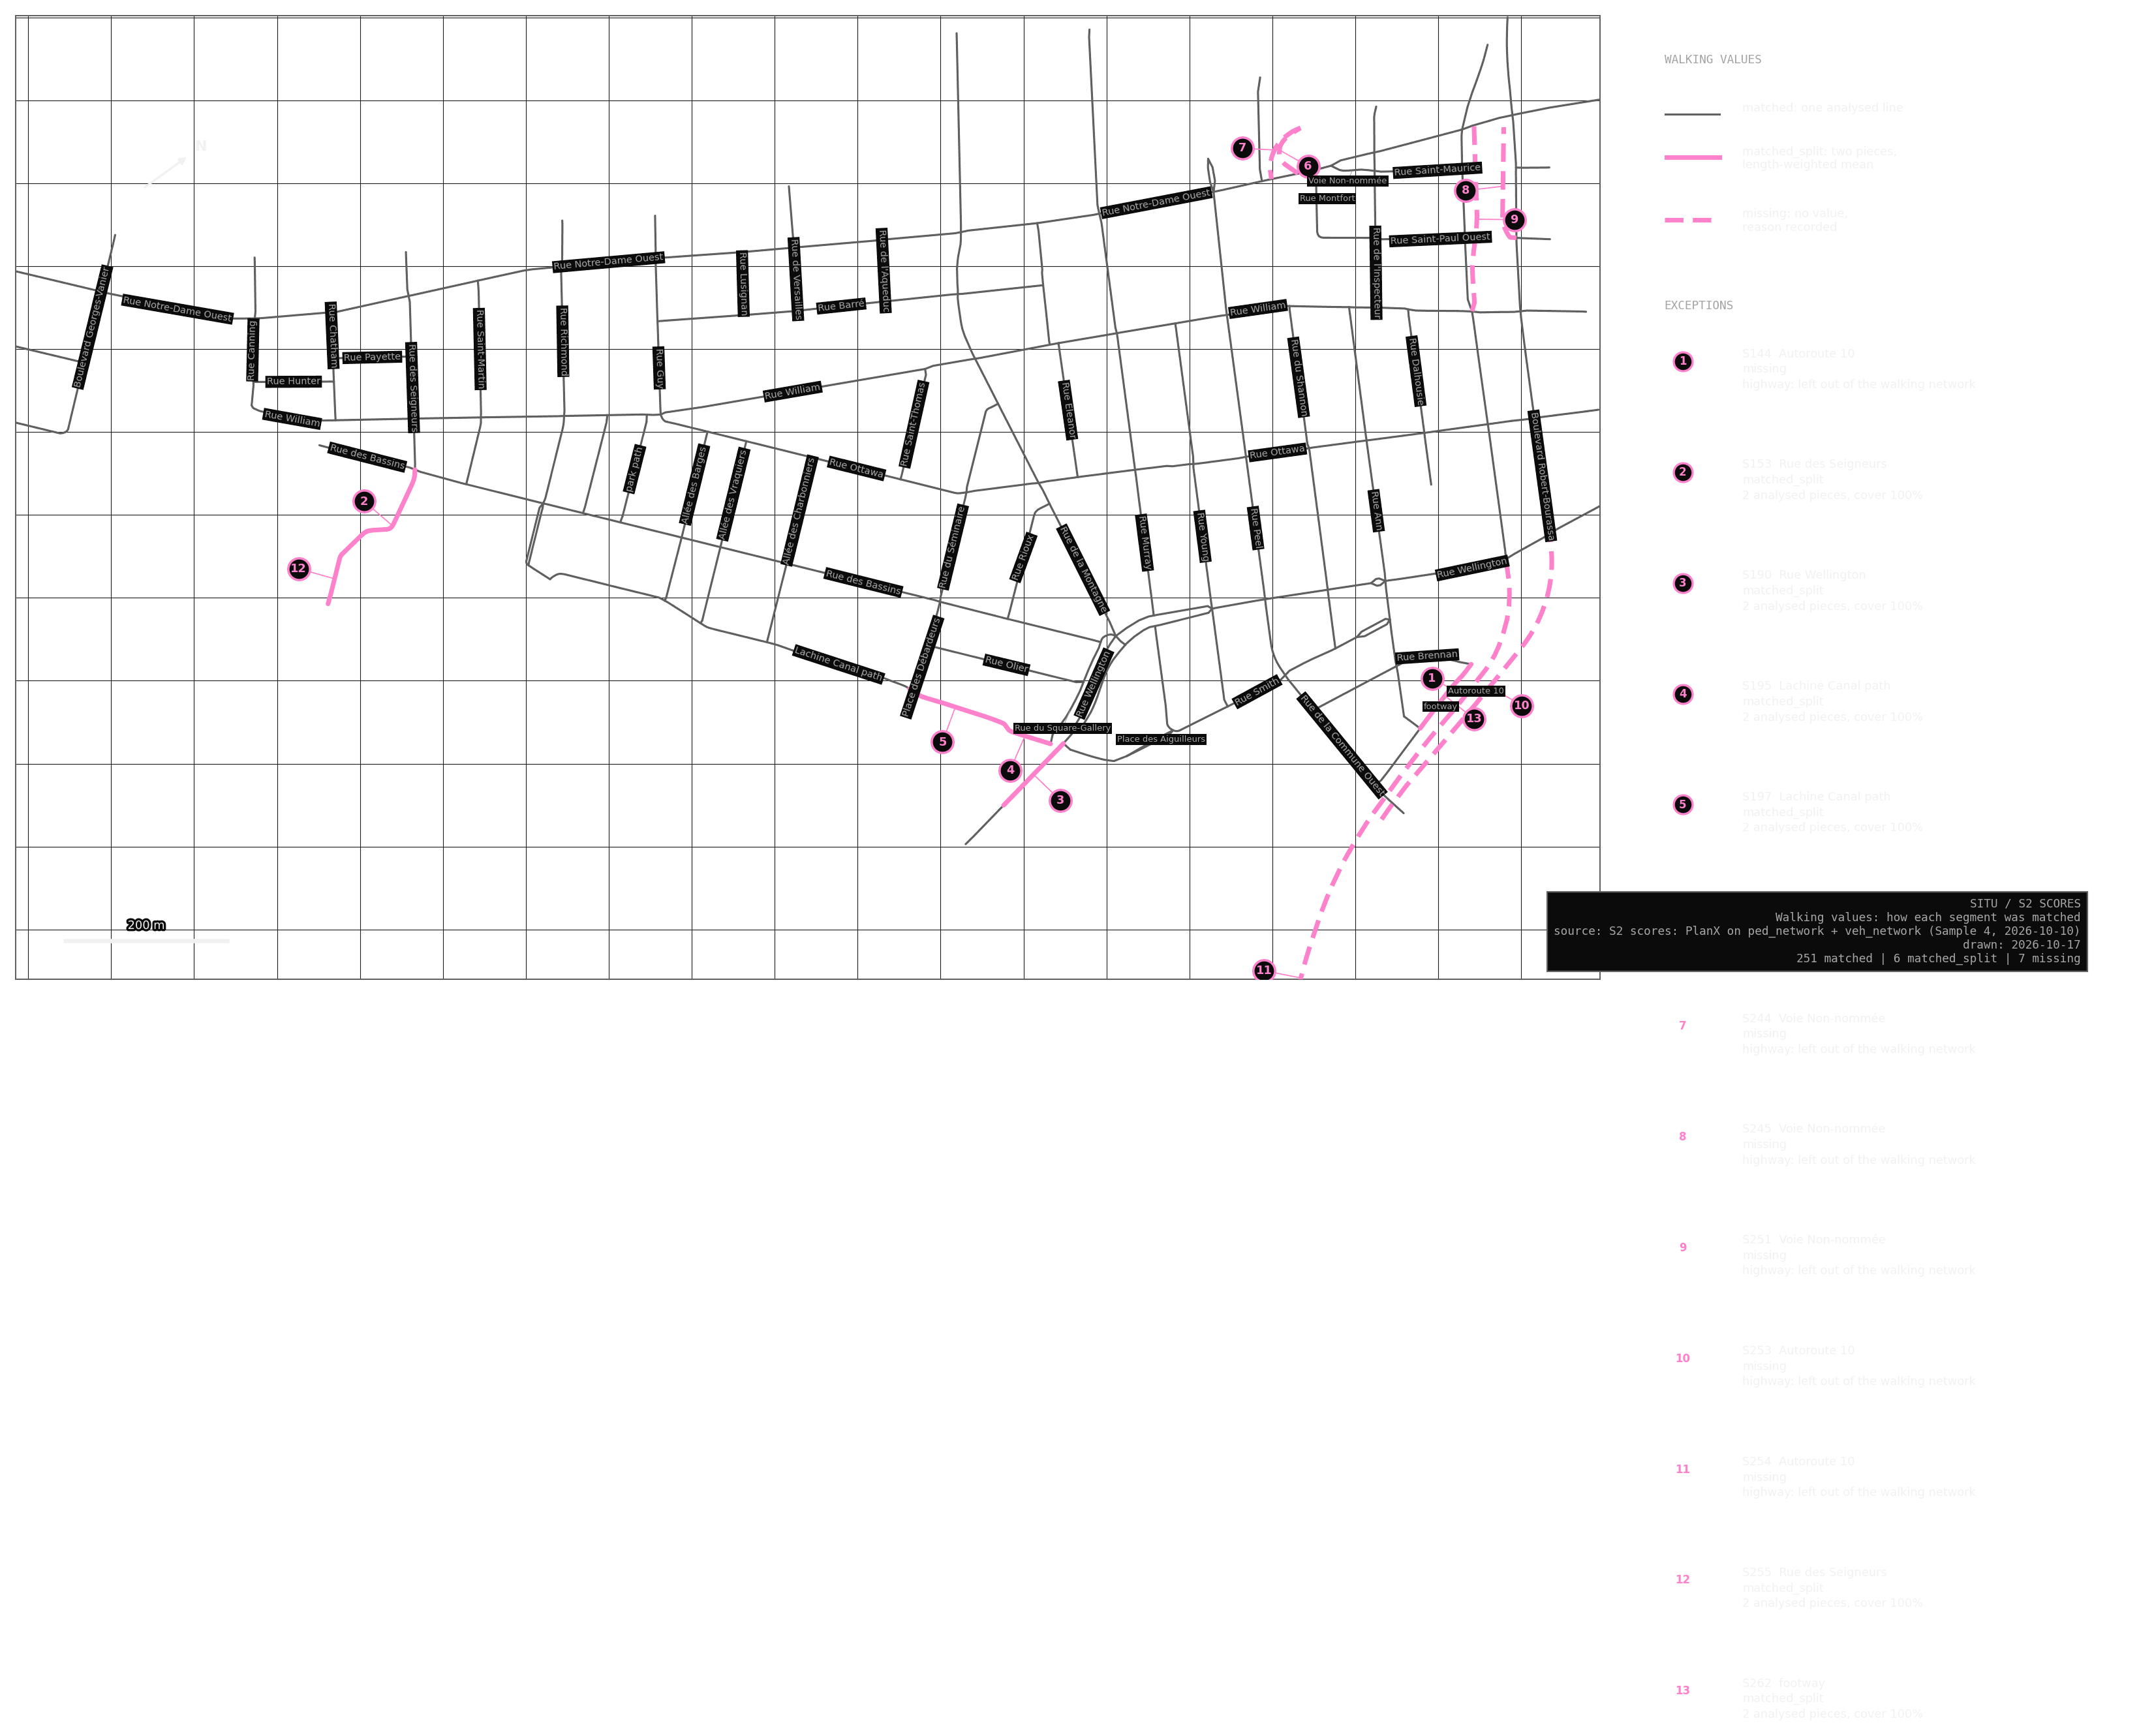
257 of 264 segments with walking values · 227 with vehicle values
Almost every segment found its street exactly: 251 match one analysed line, and six lie over two pieces of the same street, such as Rue des Seigneurs and Rue Wellington. The seven without a walking value are Autoroute 10 and its ramps, which the walking network leaves out.
The 37 segments without a vehicle value should have none. They are paths and connectors, or streets closed to cars, such as the Allées or the pedestrian ends of Murray and Smith. Before October, 31 of them carried one, because the older Sample 4 vehicle analysis included pedestrian ways.
What changed in October
On 10 October I reran both analyses on the rebuilt networks. Inside Griffintown the order of streets barely moved: the rank agreement (Spearman’s correlation, where 1.00 means no street moved) was 0.99 or 1.00 for every measure I compared.
Two changes are real, and both follow from my own decisions. Rue Brennan and Rue Ann gained walking choice (the east end of Brennan from 0.00 to 0.90, Ann from 0.37 to 0.93), because I assumed they connect to the paths beyond them. If a photo shows those streets really stop, I will reject those decisions and the values will fall back. Murray and Smith lost vehicle choice: the driving network leaves out their pedestrian ends, by the same road rule S1 uses, so cars can no longer pass through there.
Values from different networks are different measurements, so the older Sample 4 values stay for reference and are never mixed with these.
Maps
The maps show four of the 13 values S2 holds for every street: walking at 800 m, about a ten-minute walk, and driving at 2000 m, a short trip by car. The radii are my choice. 400 to 800 m is the usual low radius in space syntax studies (van Nes & Yamu 2021, p. 65), and Hillier, Yang and Turner (2012, p. 165) found 2000 m often significant in city work. Neither source ties 2000 m to cars, and neither radius comes from Griffintown’s data.
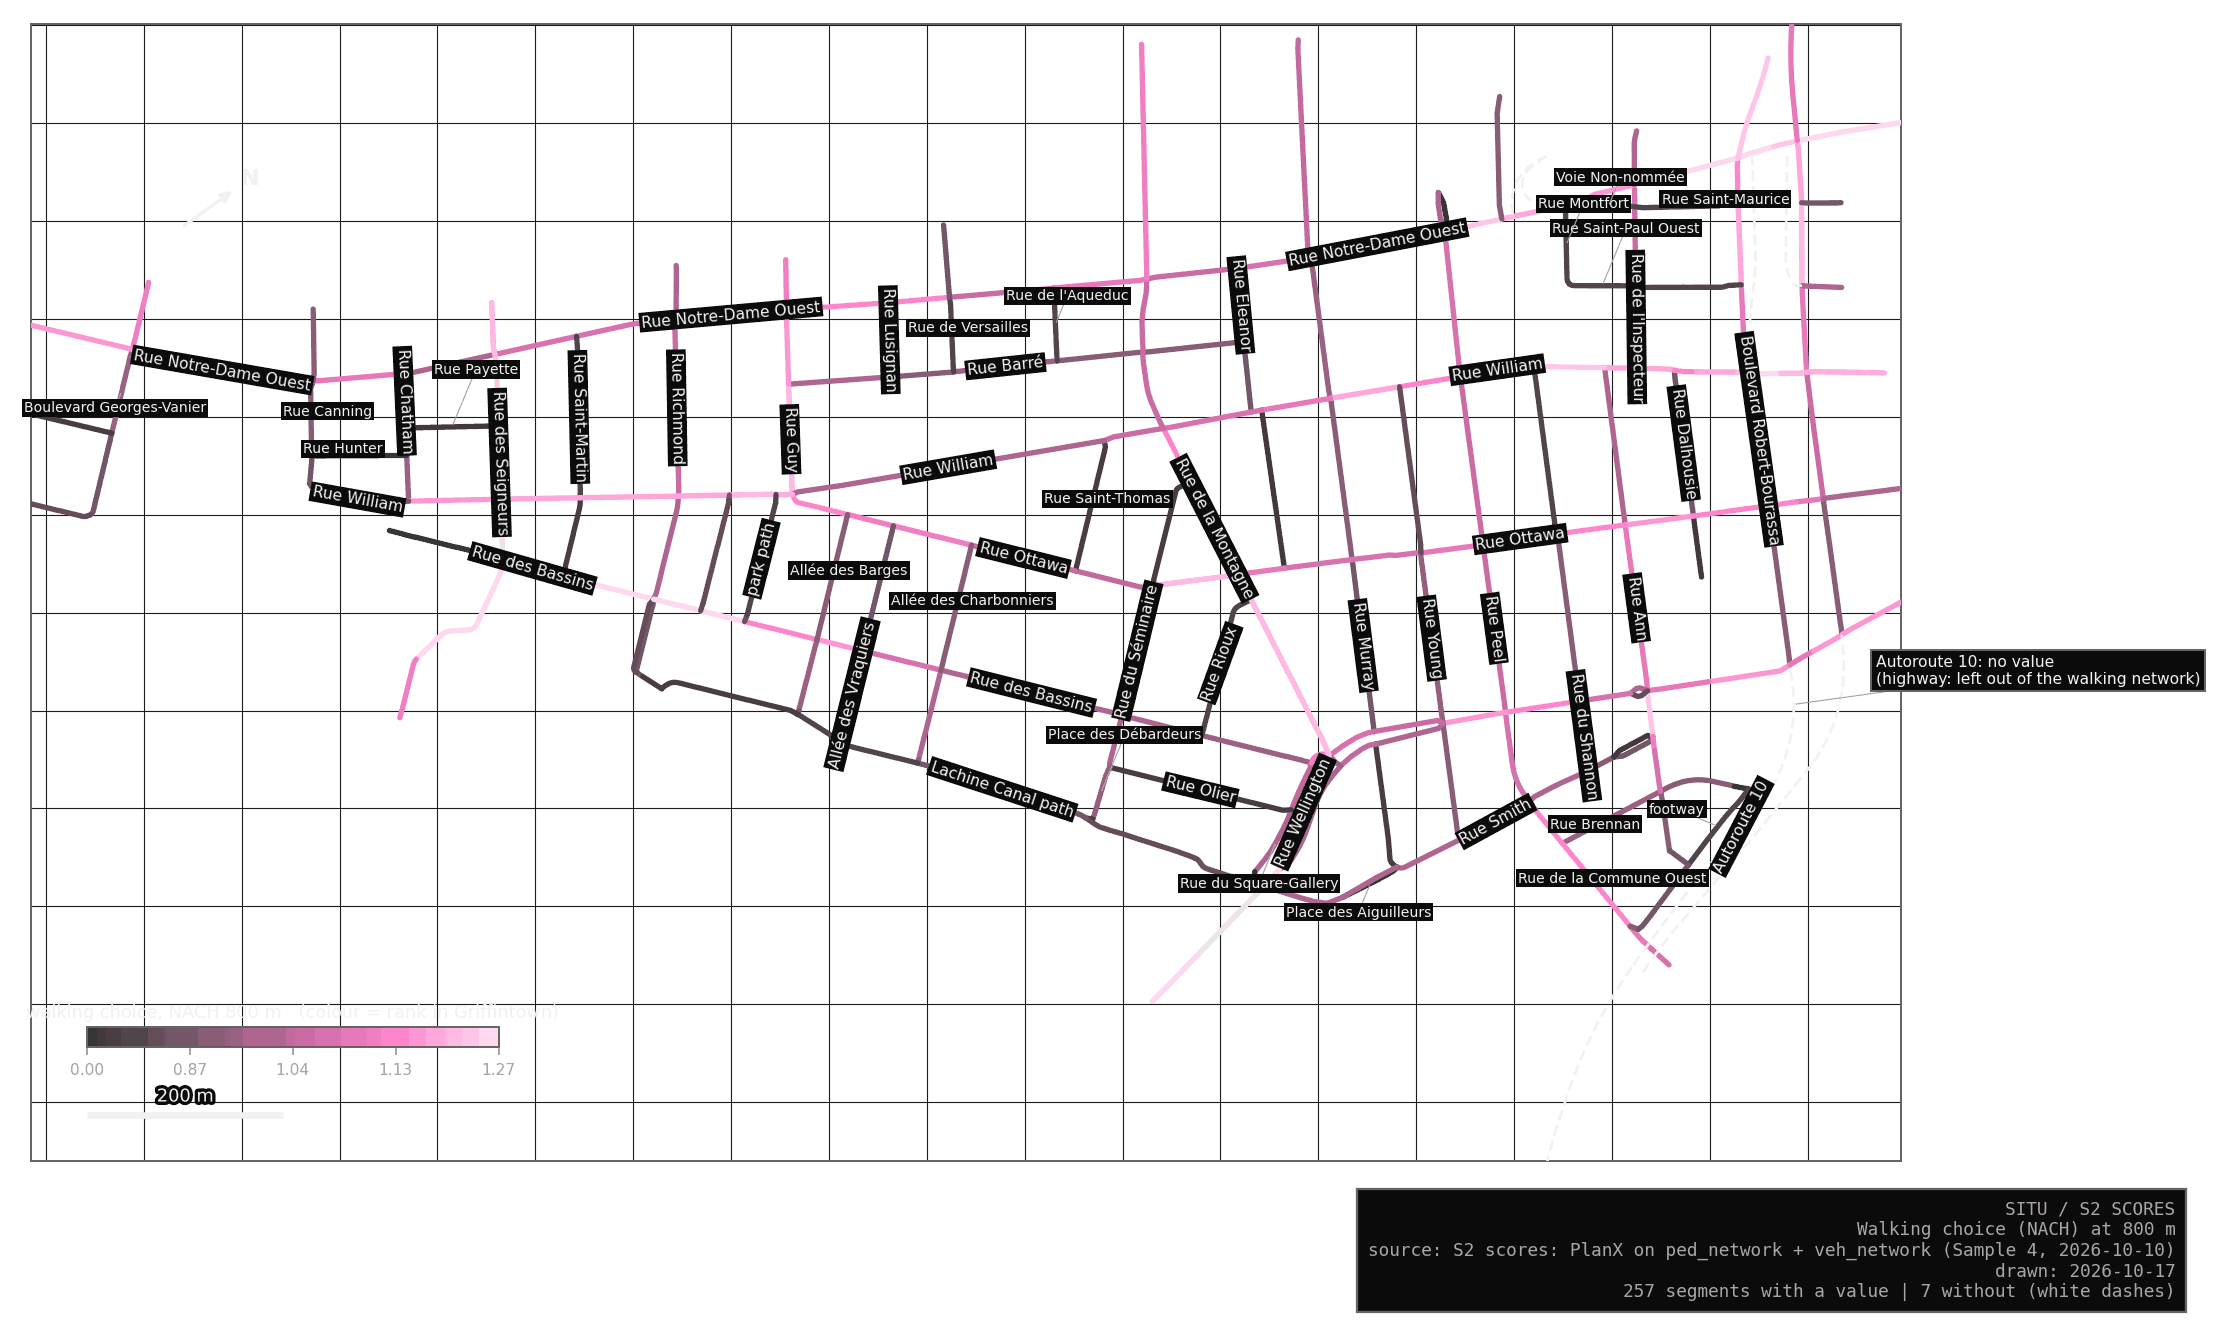
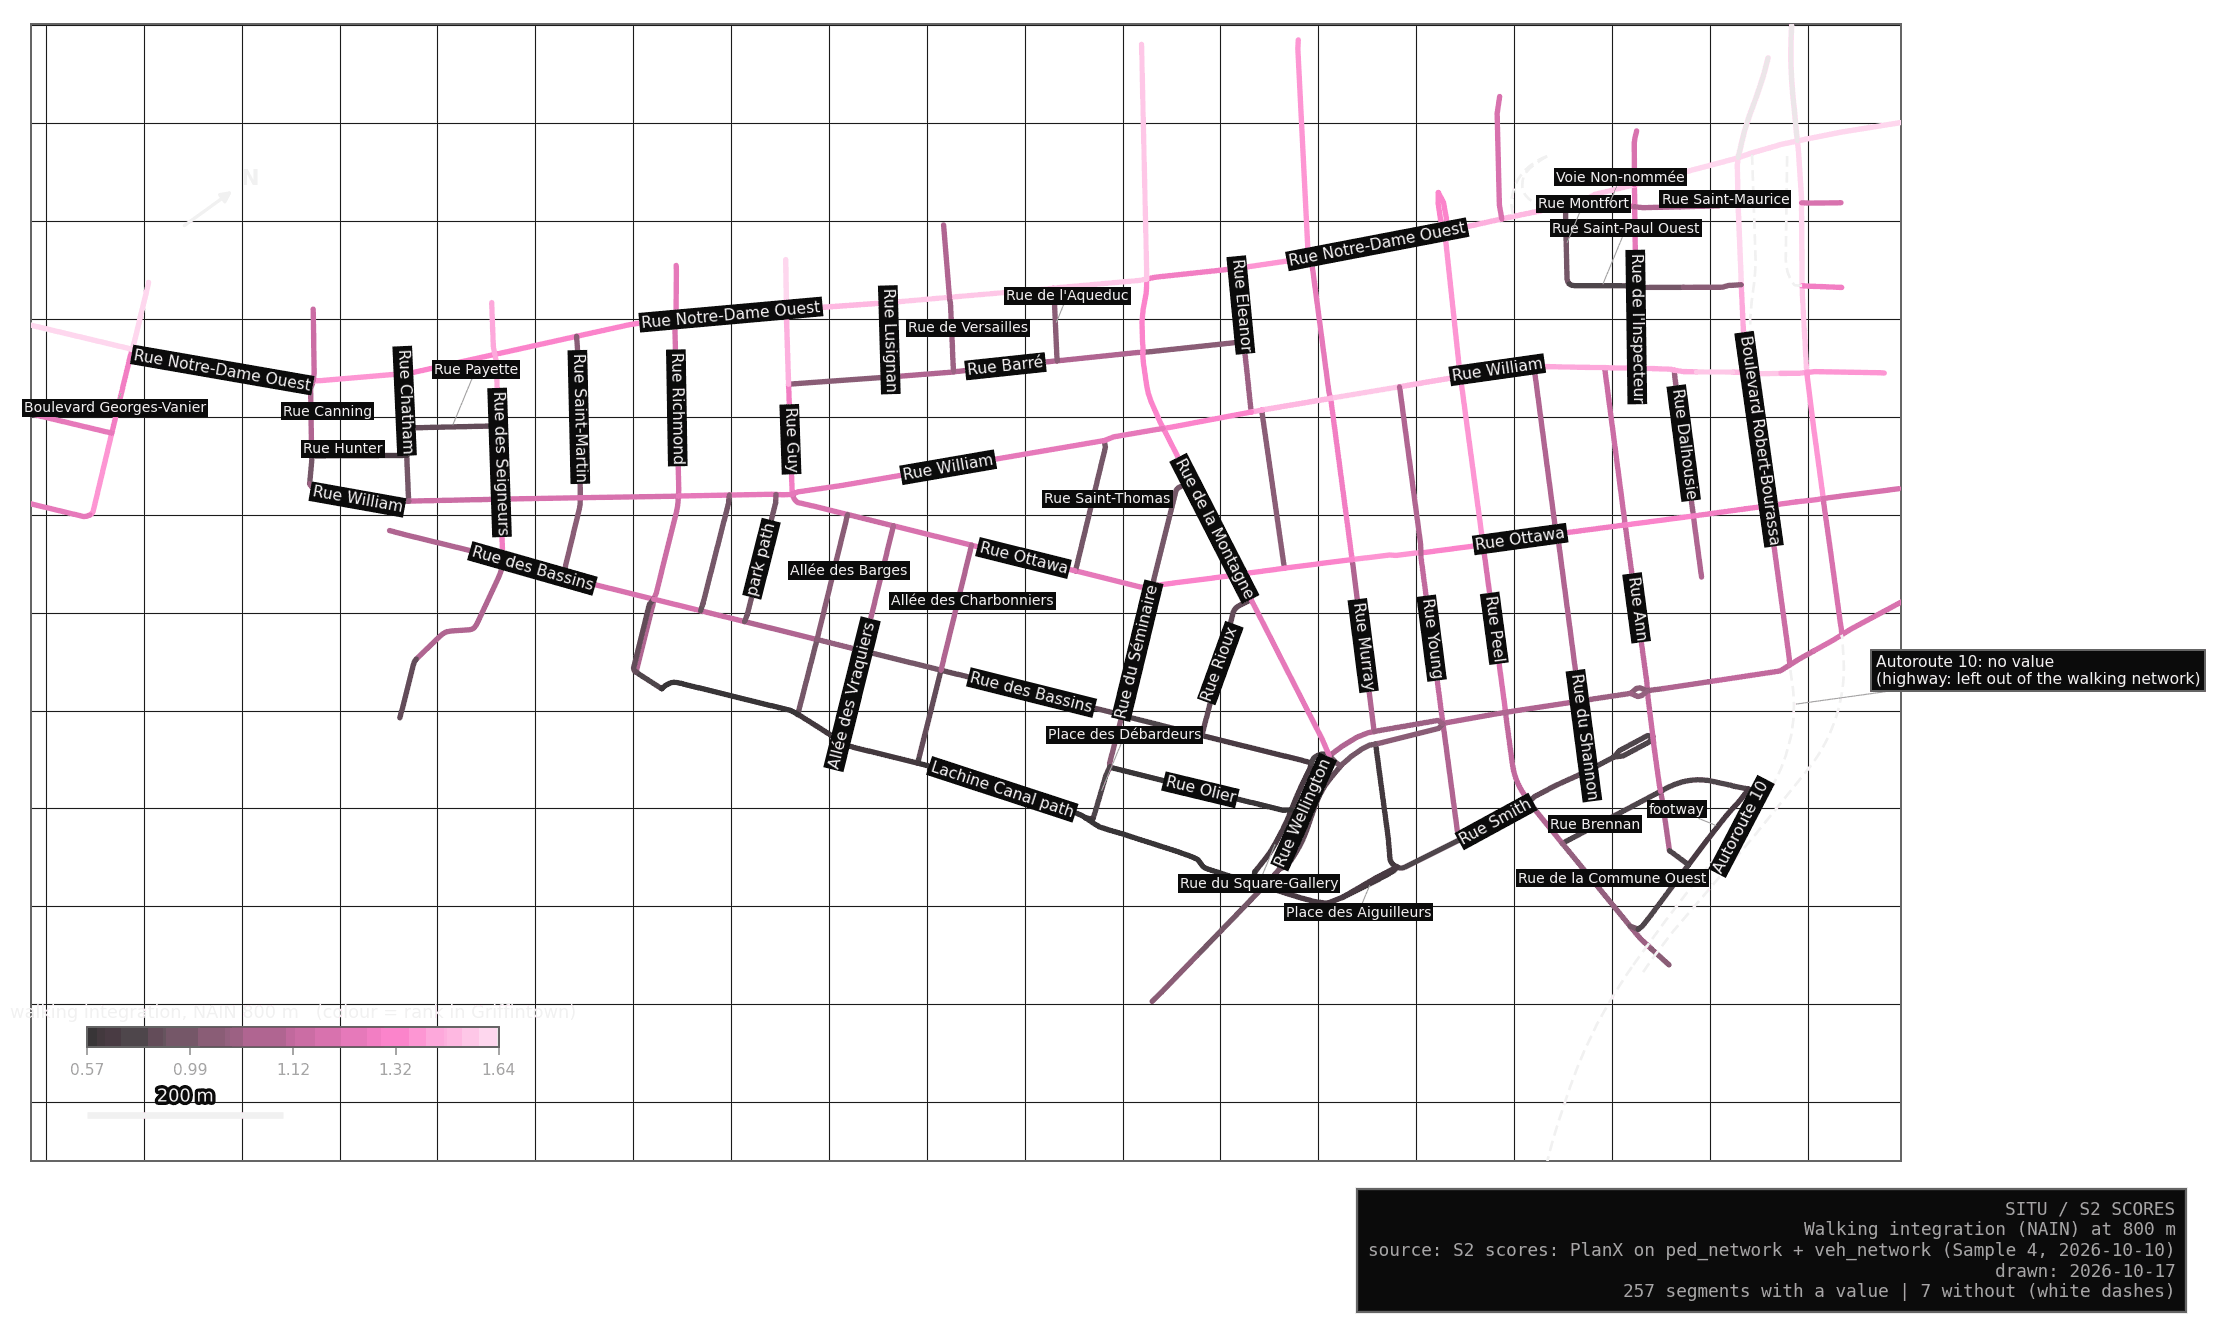
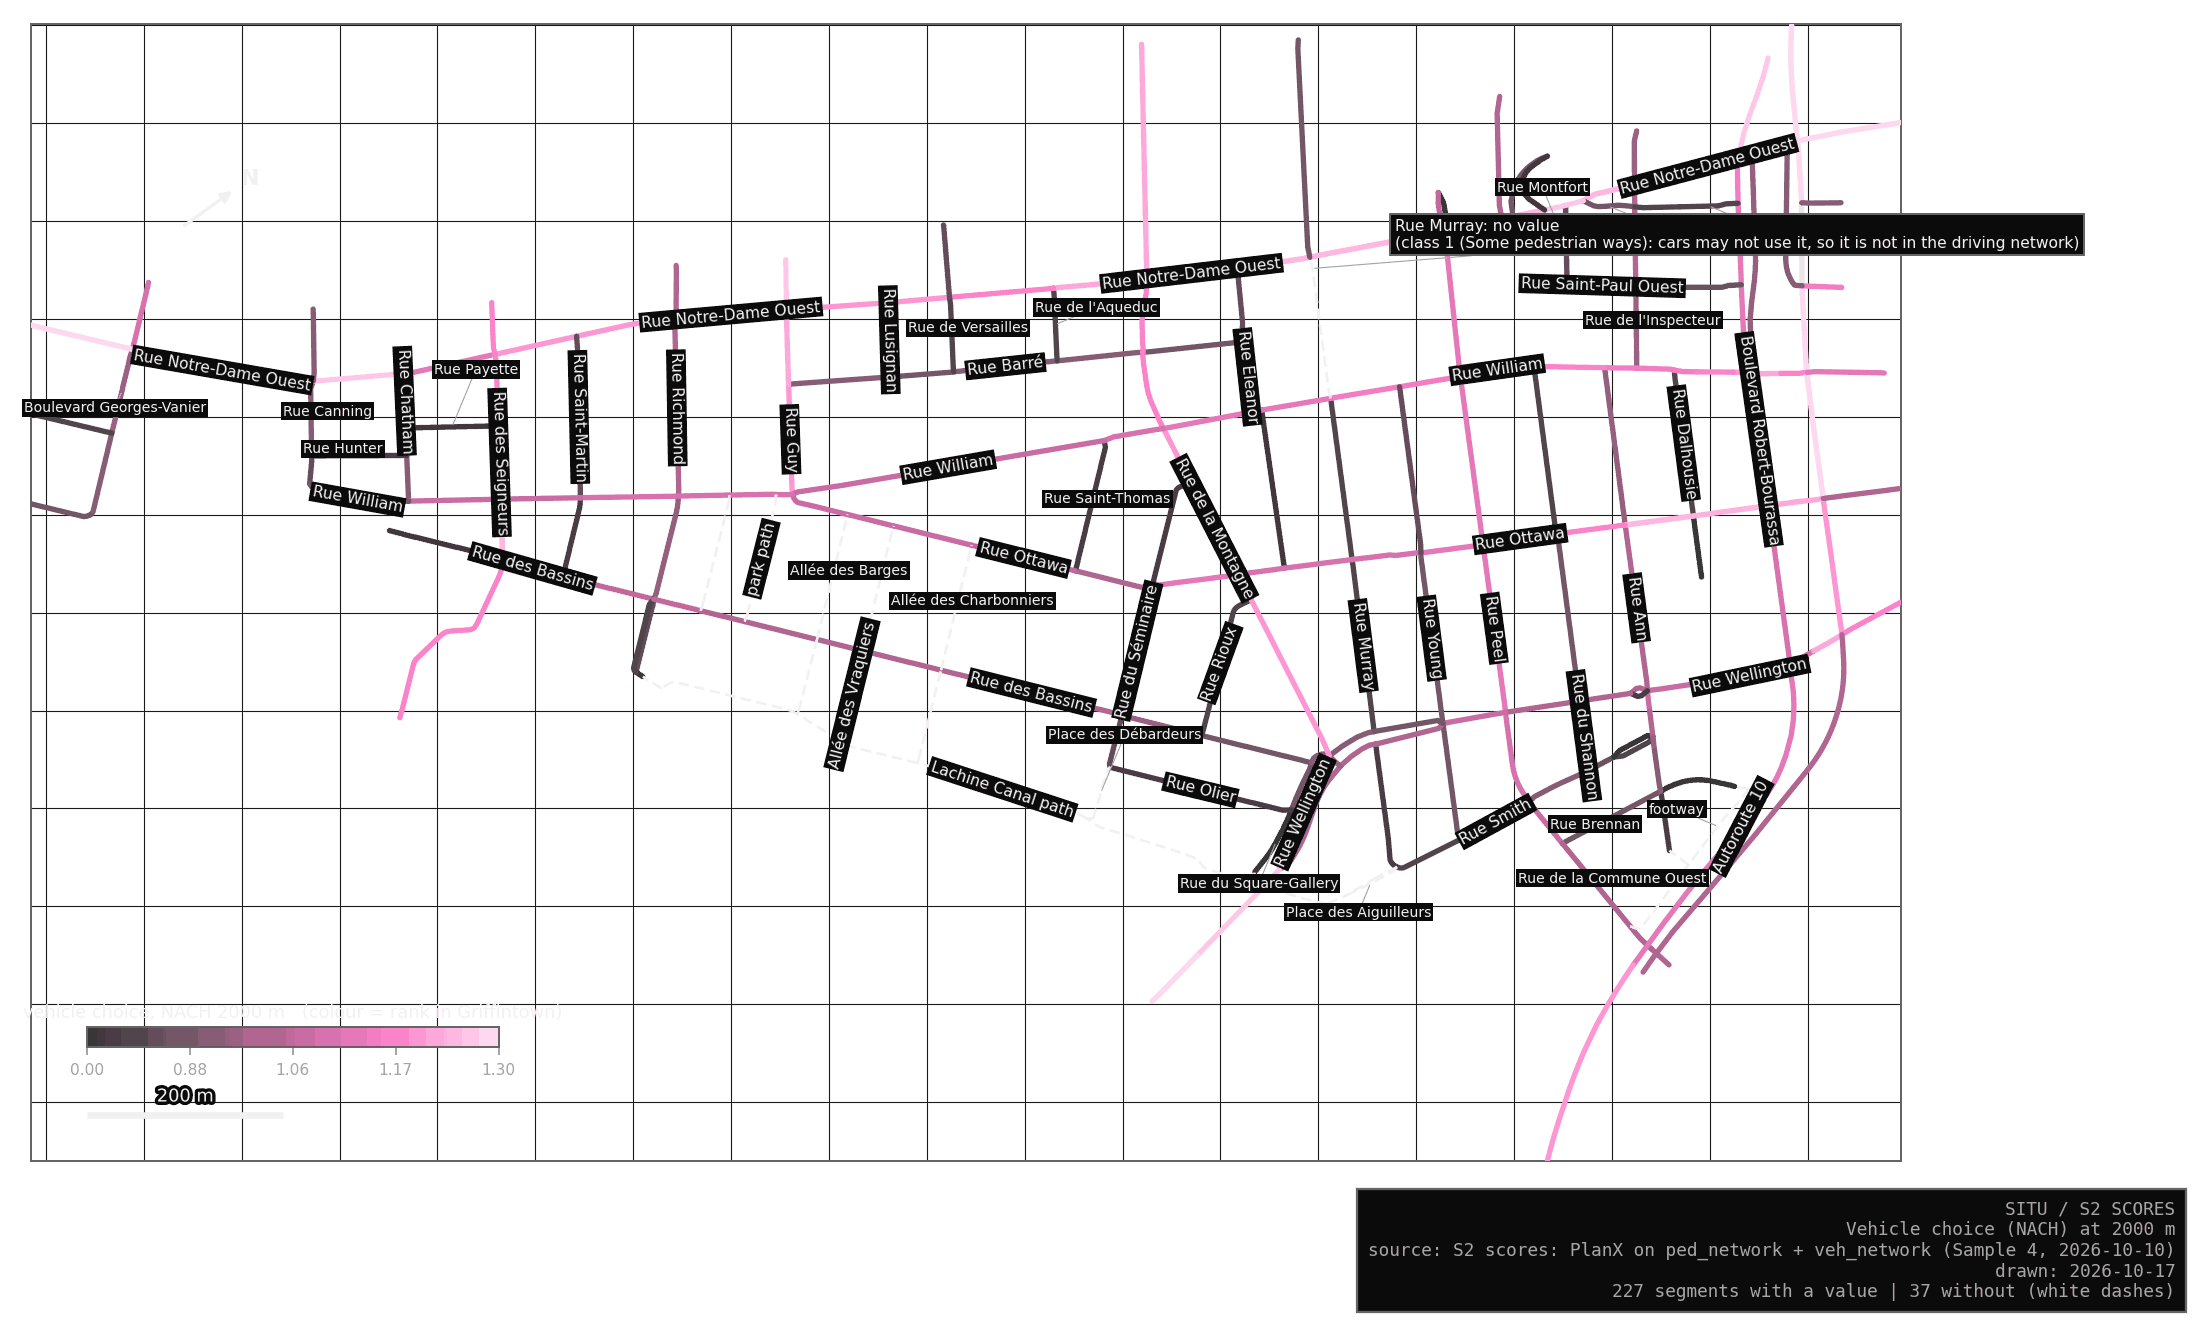
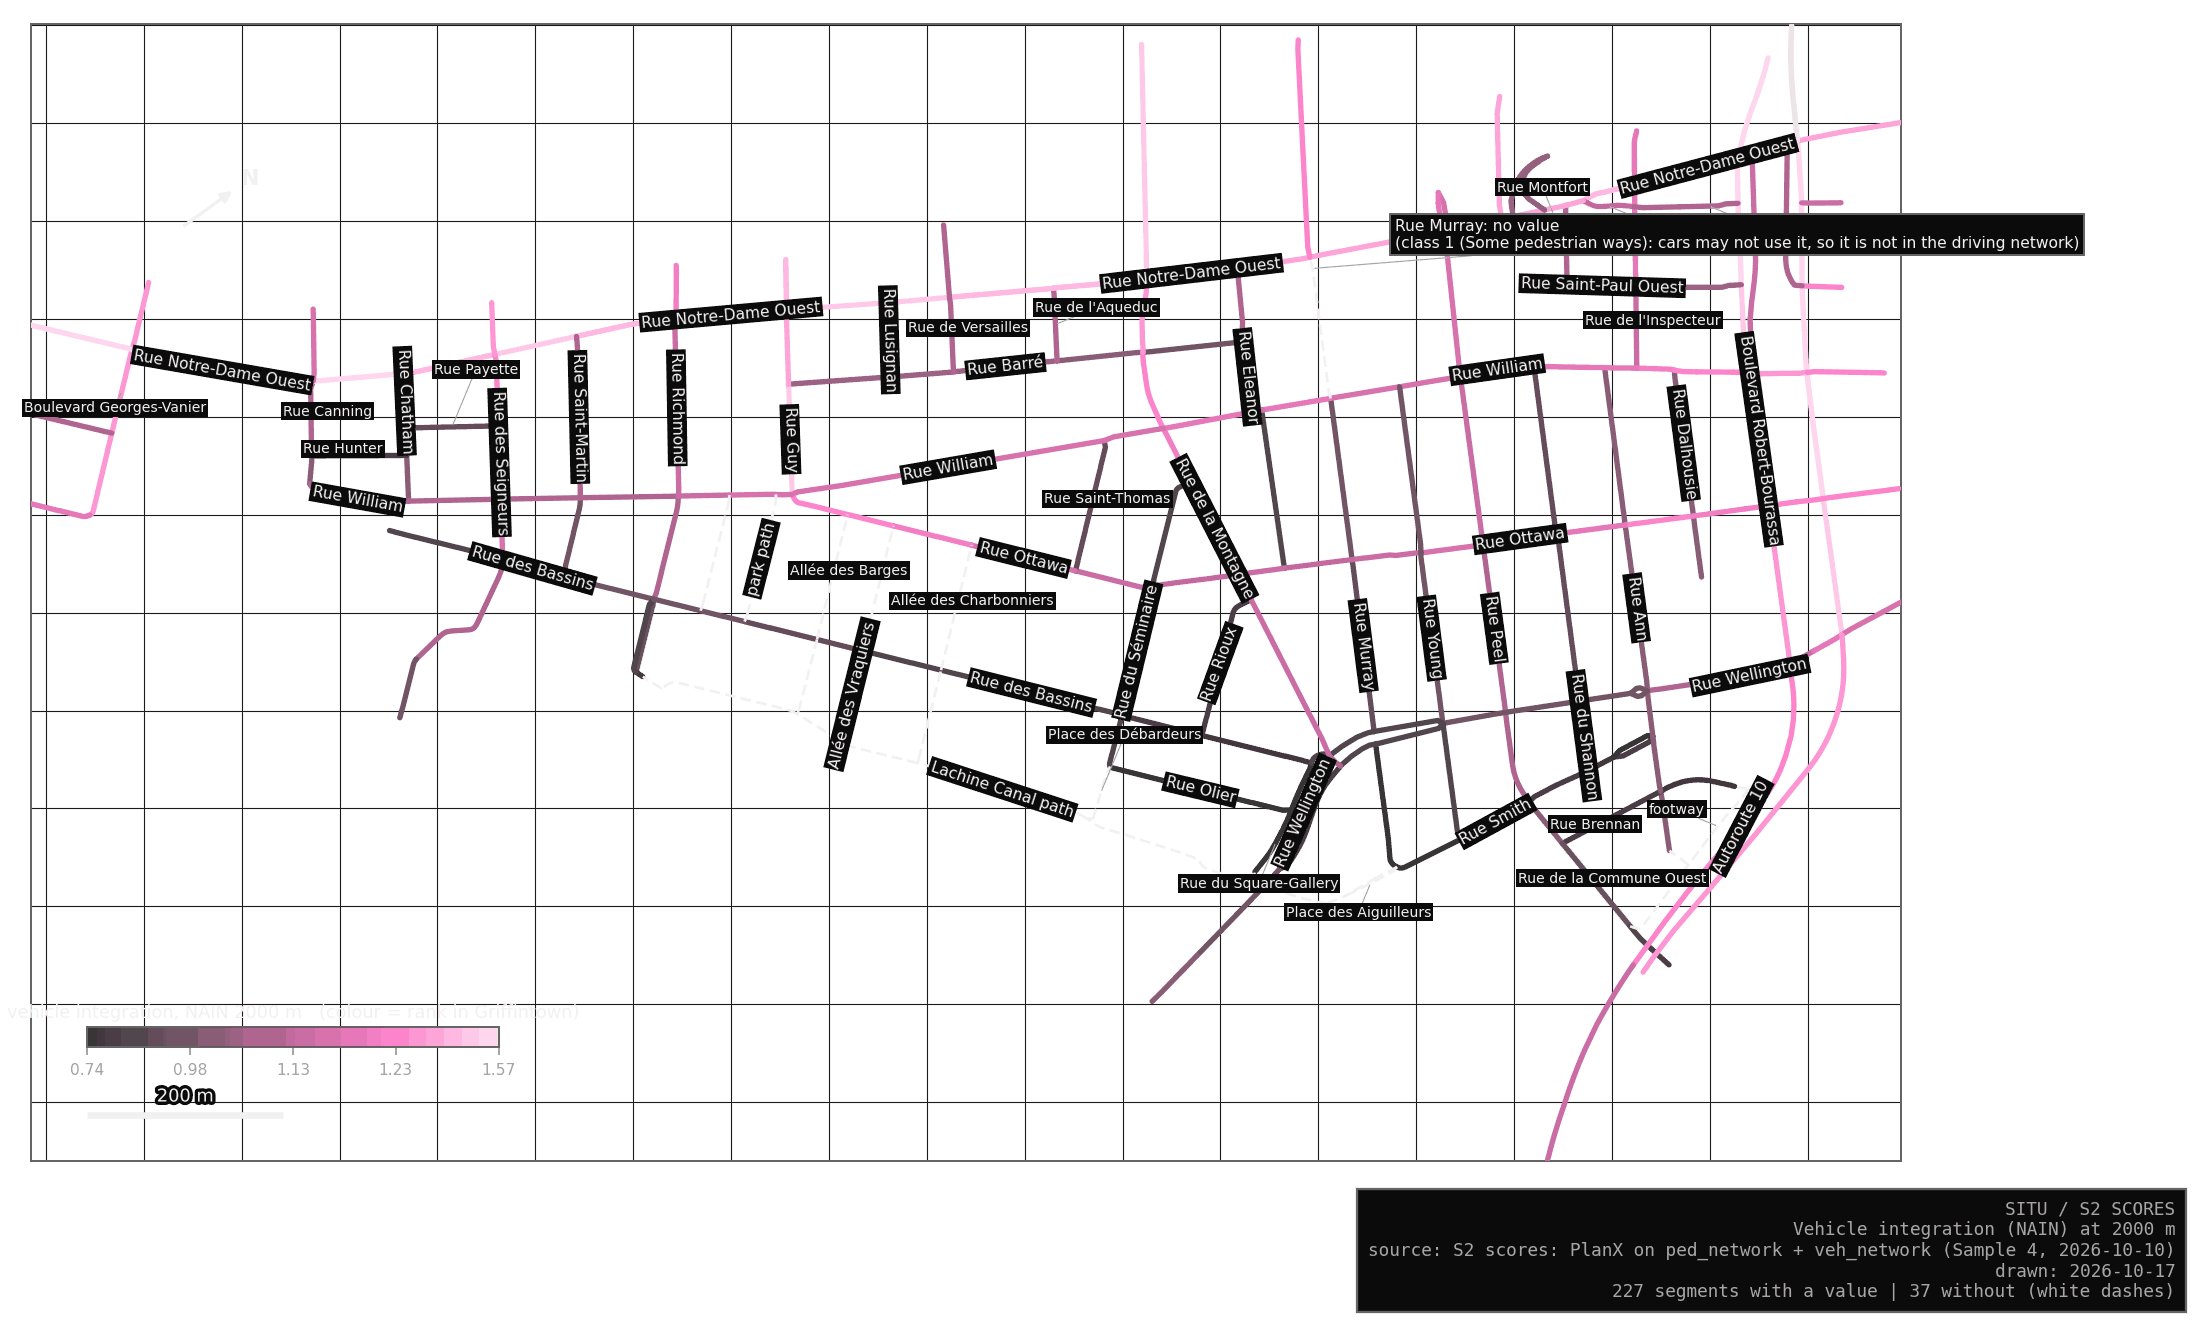
The S2 tab of the Lab has the rest. A slider grows the radius, from 200 m to the whole island for walking and from 1200 to 2000 m for driving, and colours each street by its rank in Griffintown, from grey for the lowest to pink for the highest.
What the values say
These are readings of the layout. They say nothing yet about where people actually walk.
| Measure | Highest in Griffintown | Lowest |
|---|---|---|
| walking choice, 800 m | des Seigneurs, Guy, de la Commune, de la Montagne, Notre-Dame | Saint-Thomas, Eleanor, Saint-Martin, Olier, Dalhousie |
| walking integration, 800 m | Notre-Dame, Robert-Bourassa, Guy, Georges-Vanier, William | canal path, Olier, Square-Gallery, Smith, Brennan |
| walking choice, whole island | Notre-Dame, Guy, de la Montagne, Peel, des Seigneurs | Saint-Thomas, Olier, Eleanor, Rioux, Dalhousie |
| vehicle choice, 2000 m | Notre-Dame, Robert-Bourassa, Guy, des Seigneurs, de la Montagne | Olier, Square-Gallery, Saint-Thomas, Brennan, Eleanor |
Each street is averaged over its segments inside Griffintown, weighted by length. Streets shorter than 100 m are left out, and so are connectors and footways.
My first reading, and it is an interpretation: the long north-south streets (Guy, de la Montagne, des Seigneurs, Peel) carry the most through-movement potential, on foot and by car. The canal path is easy to pass along and hard to reach, with low integration at 800 m. S9 will test whether simulated and real movement agree.
How S2 is built
The values come from PlanX, the QGIS tool I use for the analysis, run on the walking network and the driving network. Each S1 segment takes the values of the analysed lines lying under it, within 1 m. A segment that finds too little gets no value, never a zero, and a written reason.
Blueprint
The problem
S1 and the walking network were built from the same city lines, and each cut them in its own places: S1 where a park path joins a street, the walking network wherever a bike path joins one. So an S1 segment and an analysed line are often the same street with different ends. Rue des Seigneurs is one S1 segment over two analysed pieces with different values. Matching by id alone would hide that. Matching by shape finds both.
The matching rule
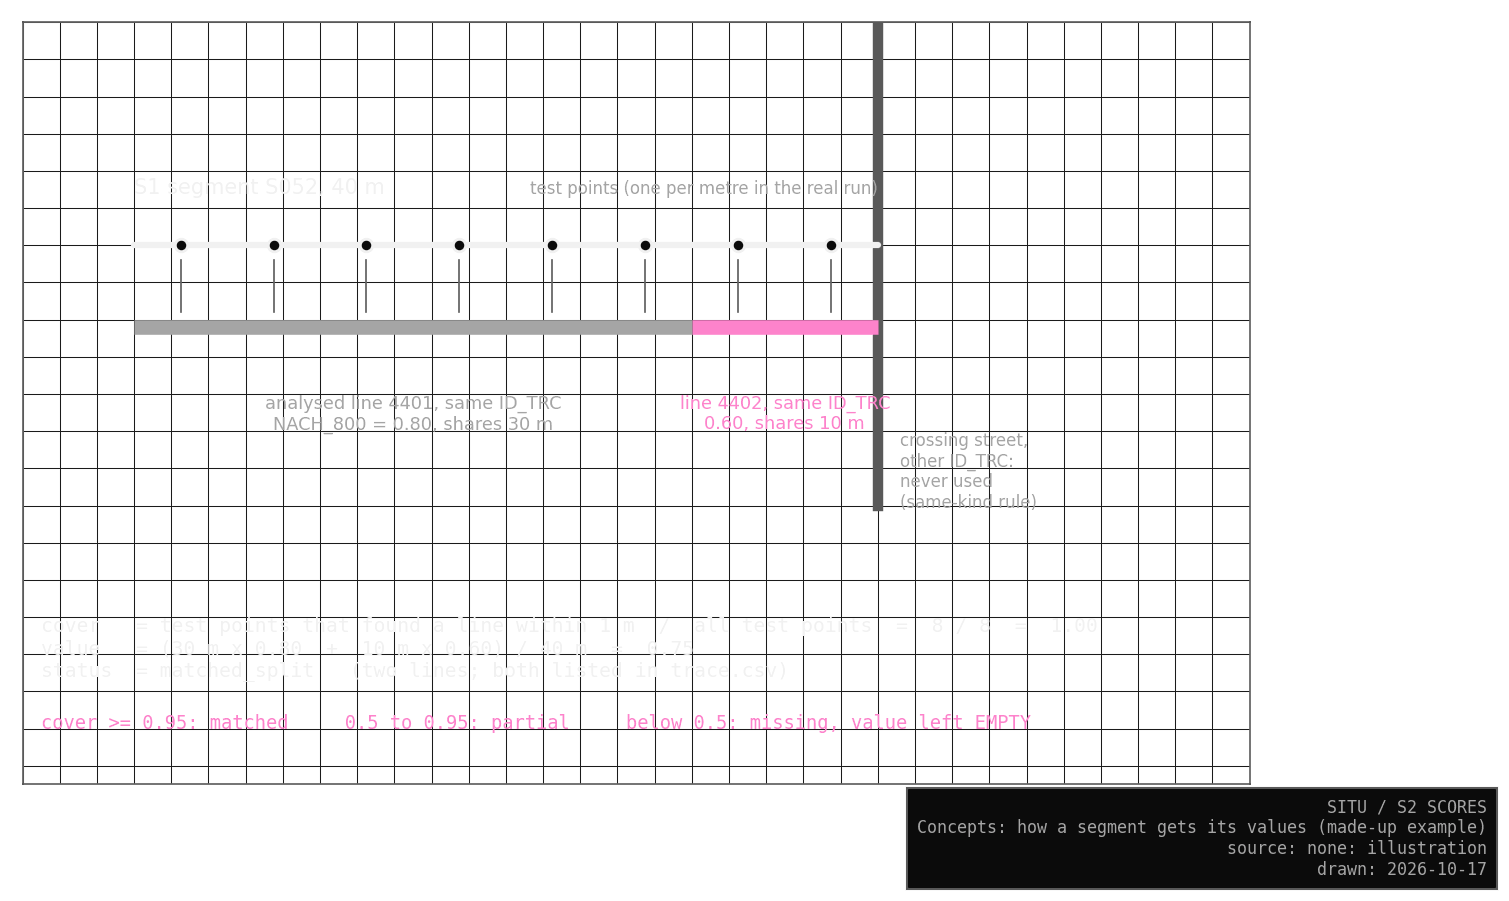
I place a test point every metre or so along each S1 segment. Each point looks for the closest analysed line within 1 m, but only among lines of the same kind: a city street looks only at pieces of the same street in the city’s records, and a path or connector only at its own kind.
The cover is the share of the segment’s length that found a line. The value is the mean of the lines found, each weighted by the metres it shares with the segment, so with one line it is that line’s value exactly. With 95 % cover or more, the segment counts as matched, or as split when its value comes from two lines. Between 50 and 95 % it keeps its value and is marked partial, so the gap stays visible. Below 50 % it gets no value and a written reason. Today no segment is partial.
The same-kind rule matters near junctions, where a test point at the end of a street also lies within 1 m of the crossing street. Without it, a street could take some of its neighbour’s values, a risk the stress tests measure.
Vehicle values
The driving network keeps the city’s lines uncut, so every S1 piece of a street simply takes the vehicle value of the same city street id. First S2 asks, by the same rule S1 uses, whether cars may use the street. Streets closed to cars and every added path or connector are marked as not roads, with a written reason. A street open to cars but missing from the analysis would be marked missing. Today there are none.
Tests
Checks
Each check asks a plain question of the result, and all of them pass. The Lab lists the latest run.
| Question | Answer |
|---|---|
| Does every S1 segment have exactly one row? | Yes |
| Is a value present exactly when it should be, and is every missing value empty, with a reason? | Yes |
| Can every walking value be rebuilt from the trace of analysed lines behind it? | Yes |
| Is any value invented, or outside the values of its lines? | No |
| Do values come only from the same kind of line, and from the same street for city streets? | Yes |
| Do vehicle values equal the vehicle analysis for the same street? | Yes |
A seventh check only reports coverage, the numbers given under Result.
TipThe trace check caught a real problem
On the first run the trace check failed. The trace rounded the shared metres to two decimals, too coarse to rebuild the values exactly, so I now store them to six.
Stress tests
The stress tests ask how easily the result could go wrong, by changing one thing on purpose and measuring what moves.
Two runs on the same input give identical results. Any matching distance from 5 cm to 10 m gives the same result, and test points every 25 cm or every 5 m move a value by about 0.01 at most. Shaking every S1 point by up to 0.3 m changes one segment, a 15 m connector at Brennan, which then takes part of its value from the next connector. At 0.8 m six segments change status, mostly paths and connectors along the canal, and no value moves by more than 0.08.
The test that matters most turns the same-kind rule off. With nothing shaken, no segment then takes values from another line. Shaken by 0.8 m, 142 segments do, and the worst, the short Smith link, moves by 0.24 as it takes values from the streets at both its ends.
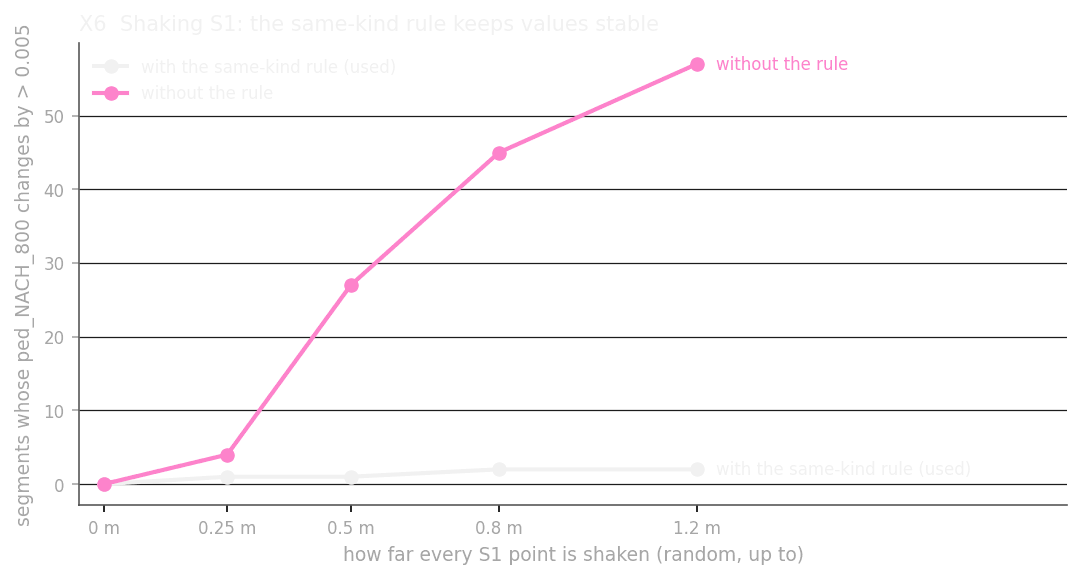
The match is exact today because S1 and the walking network share coordinates, so the matching distance has no effect. If the geometry drifted, for example after someone edits S1 in QGIS, the same-kind rule would keep S2 honest.
The rule test also found a fault upstream. Before a fix, Rue Smith picked up 21 m from a connector lying on top of it: the C06 link, which joined Smith to its own other end. I fixed the rule in S1 (C06), and after the new PlanX run no such segment remains.