S5 Rhythm
What S5 does
S5 gives each hour of the week what the open data says about it. Henri Lefebvre proposed reading a city through its rhythms, the repetitions of days and seasons (Lefebvre 2004). S5 is the first system in Situ that holds time, and it starts from two kinds of evidence that I keep apart.
The first is measured: how busy the streets are, hour by hour, from the city’s movement counts at S1 junctions. The second is promised: which places say they are open, from the opening hours S4 gathered. A count records what happened on one day. An opening hour records an intention, and a place can be open and empty. S5 never mixes the two, and a later system that reads S5 knows which one it is reading.
Neither one is a simulation. The promised hours can time the walkers and drivers S9 will imagine. The measured day stays out of them, so that S9 can compare what they do with it.
What was measured
9 counted days · 7 junctions · no weekend
The city counted seven S1 junctions on nine days, all of them midweek, from Tuesday to Thursday. Only J040, where Guy meets Ottawa and William, was counted around the clock, for three days in December 2024. The other six were counted on a single day, in three windows that cover the two rush hours and midday.
Junctions differ in size: J051 on Notre-Dame sees about four times the people J006 on Ann sees. So S5 compares shapes. Each day is divided by its own average over the six hours every day counted (7h, 8h, 11h, 12h, 16h and 17h), which makes 1.0 an ordinary daytime hour of that day. A weekday hour then takes the mean of the days that counted it, with their lowest and highest. How S5 is built gives the rules.
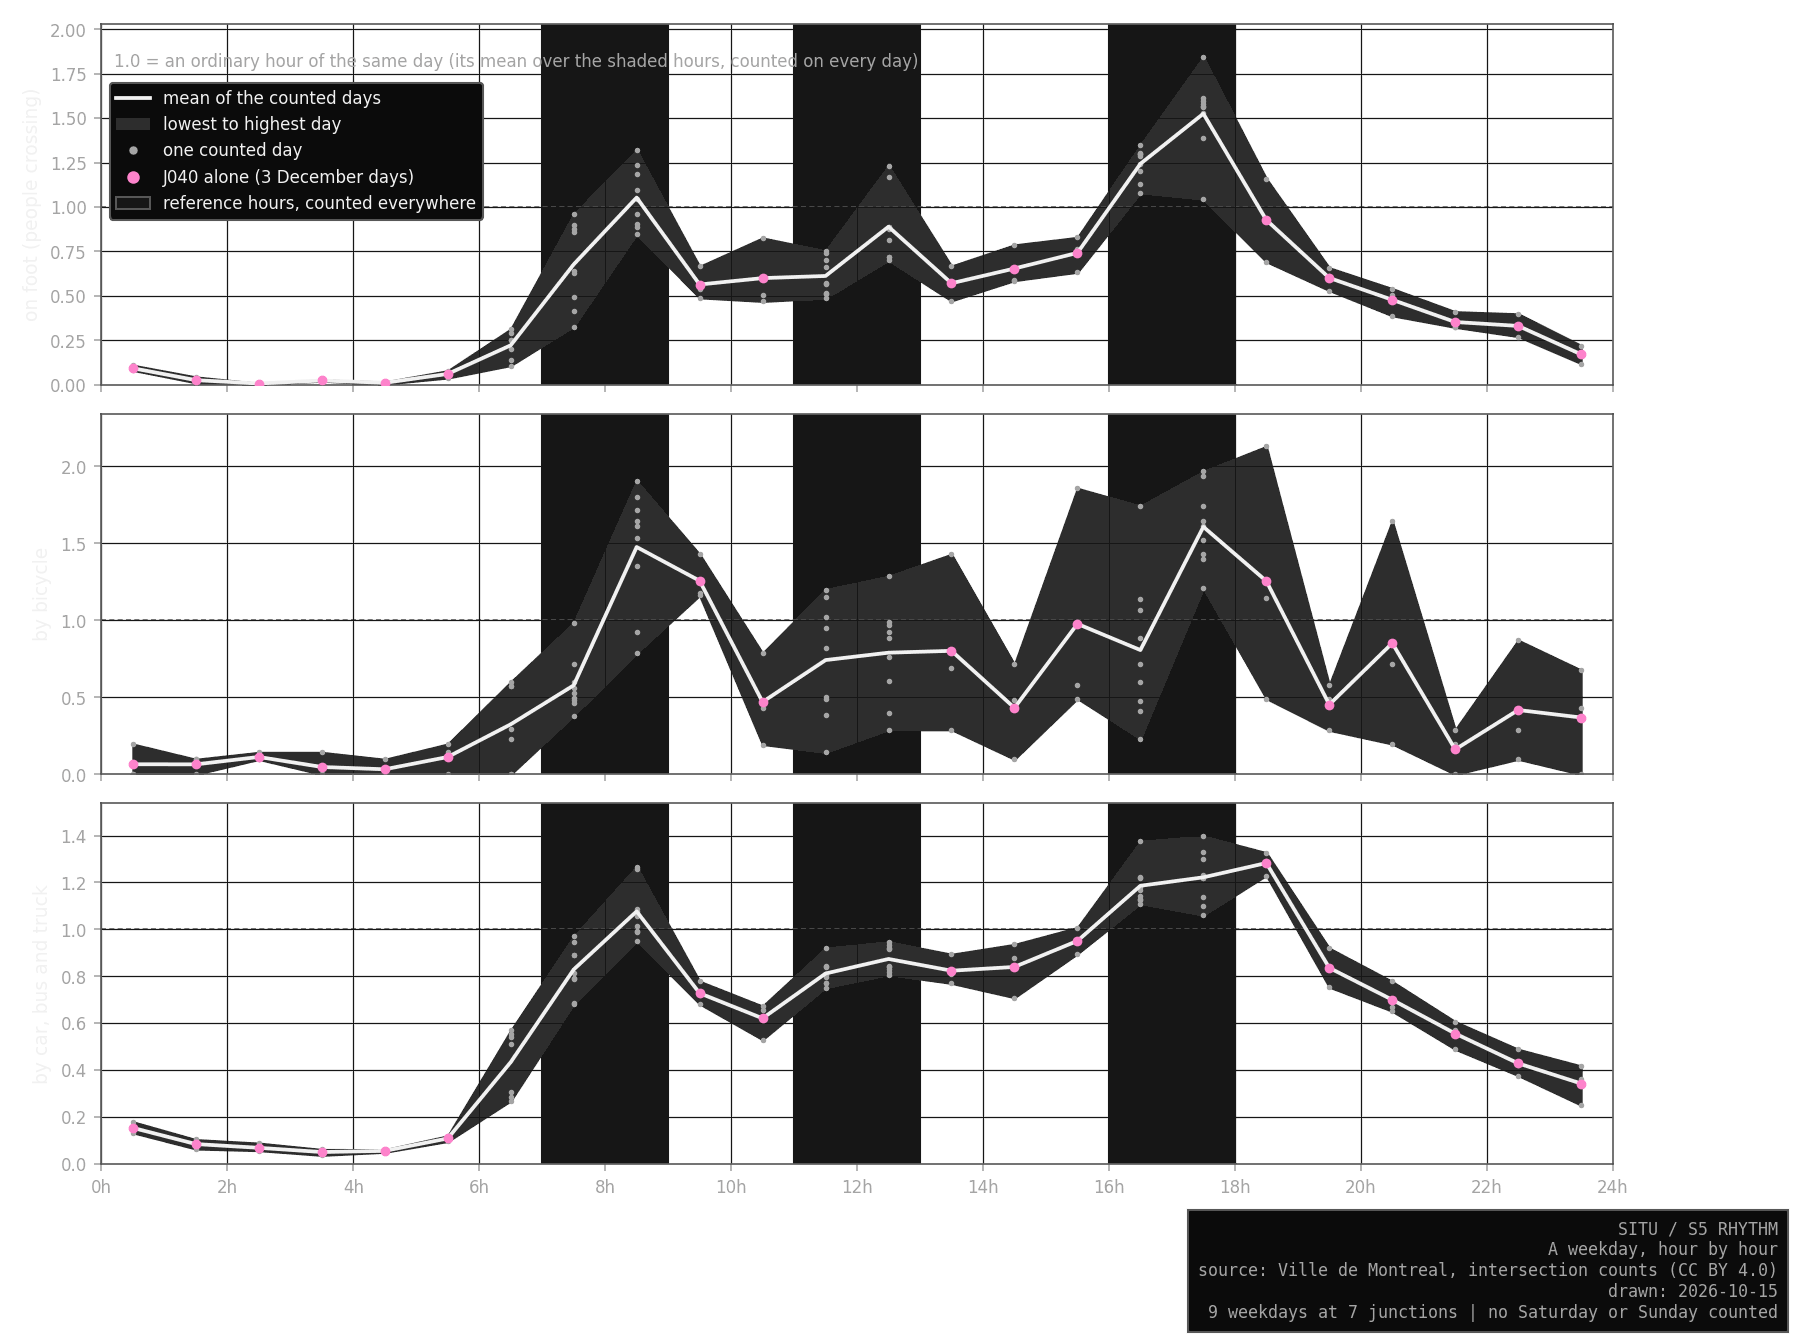
The shape has a value for every hour of a weekday, and 17 of the 24 hours rest on J040’s three December days alone (certain). Everything from 18:00 to 6:00 is one junction in winter.
My first reading, and it is an interpretation: people on foot have a sharper evening than morning, peaking at 17h at about one and a half times an ordinary hour, against just over one at 8h. Bicycles peak twice, at 8h and 17h. Cars spread their busy hours from 16h to 19h. On Wellington, on the one Thursday in February when four of its junctions were counted, Murray and Young carried the most vehicles at 8h, and Ann and Shannon at 17h. Only one day stands behind that difference, so it stays a question for the field.
Bicycles, every day of the year
376 days · 3 detectors · 59 Saturdays, 57 Sundays
The city also keeps permanent bicycle detectors, which record every hour of every day. Three stand inside the study area: two on Peel at Ottawa, one for each direction, and one on William at Nazareth, westbound. All three were complete on 376 days between 9 June 2025 and 14 October 2026. For bicycles, S5 can therefore speak about weekends and seasons. Each day is read the same way as the counts, against its own reference hours.
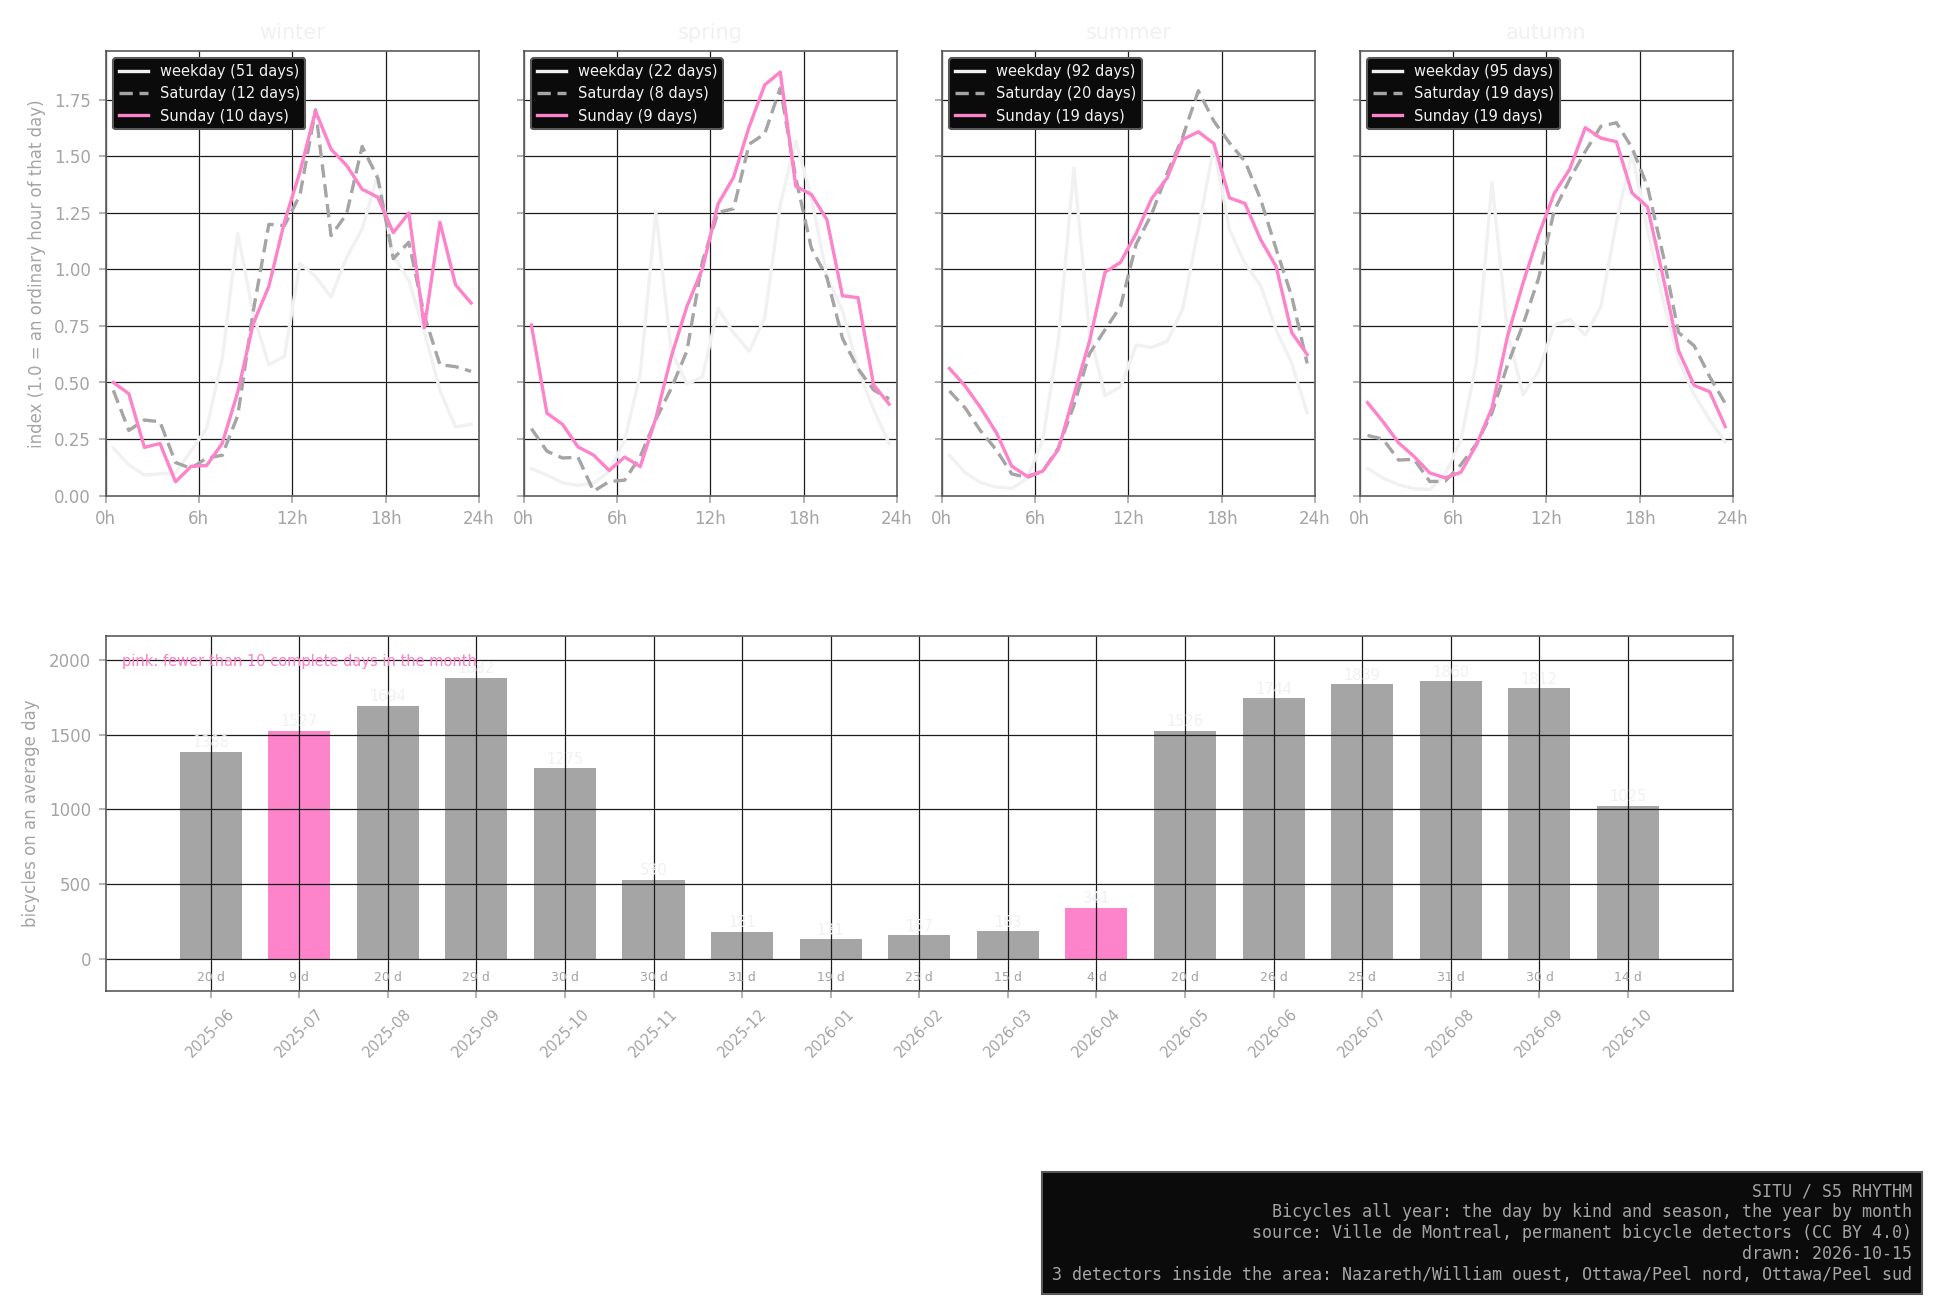
The year has a strong swing (certain, for these three detectors). An average day in August or September brings about 1,800 to 1,900 bicycles past them, against 130 to 180 from December to February, roughly ten times fewer. The week matters less: in summer a Saturday brings nine tenths of a weekday’s bicycles, and a Sunday about three quarters.
The kind of day changes the shape more than the amount. Every weekday, in every season, has two sharp peaks, at 8h and 17h. Saturdays and Sundays have no morning peak at all: bicycles build through the day to a long afternoon, highest between 13h and 17h. My reading, and it is an interpretation: on weekdays these streets carry a commute, and on weekends an outing.
The two sources agree where they meet. On weekdays the counts’ bicycle shape follows the detectors’ closely, with a correlation of 0.89 over the 24 hours (likely a real agreement, since the streets and the years differ). The largest gap is at 19h in winter, where the counts rest on J040 alone. Two more detectors stand on Peel at Notre-Dame, just outside the area, and S5 leaves them out.
What the places promise
83 of 558 places give their hours
Of the 558 places S4 found, 83 give opening hours (15 %), almost all through OpenStreetMap. Restaurants and cafés lead; the rest are mostly shops, bars, banks and parks. The other 475 stay unknown at every hour. S5 never reads a missing hour as closed.
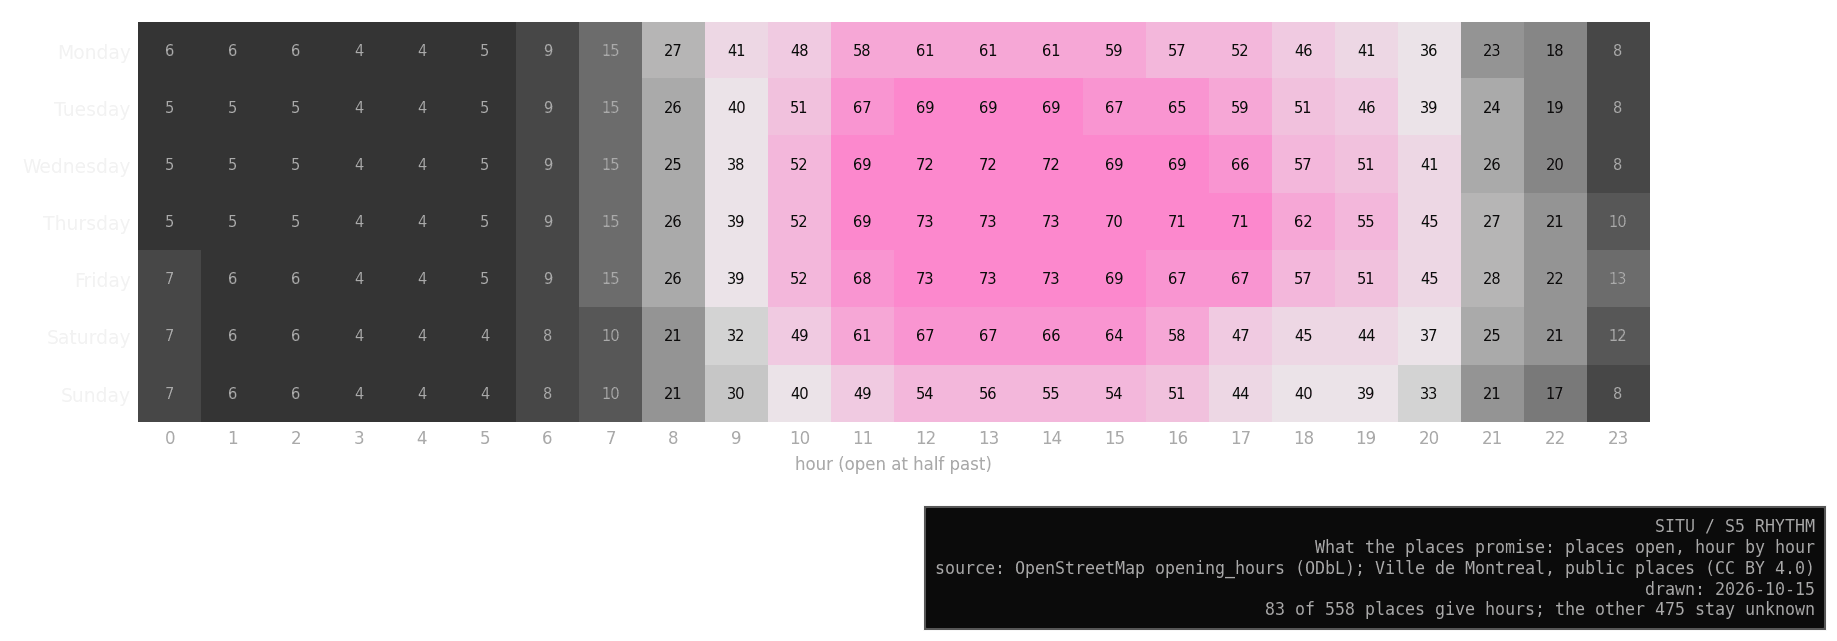
The promised week peaks around midday from Tuesday to Friday, with 73 places open at its height, and thins on Sunday to about 56. By 21h fewer than 30 remain. Two places give hours S5 cannot read with certainty, and they are its checkpoints: Henden opens at 19:00 with no closing time (H01), and SHAY’s brunch rule, read the way the tag’s grammar says, replaces its weekend dinner hours (H02).
What S5 cannot say yet
The bicycles now have weekends and seasons; people on foot and cars still have neither. The places say Saturday is almost as open as a weekday, and no count of walkers exists to tell whether they come. The counts fall in February, May, November and December, while the bicycles show how much summer changes a street. The three detectors stand on two streets, so they tell the rhythm of cycling on Peel and William, which may differ from the canal path’s. Lingering escapes every count, since a count records people passing a point and says nothing of those who stay.
The rhythm diaries and rhythm maps of my fieldwork will add a third kind of evidence, people’s own account of their week, once ethics approval comes (Limits of the desk).
In the Lab
In the Lab, the S5 tab sets a day and an hour. Places light up when they say they are open, and each counted junction grows with that hour’s count. Play the day to watch it fill and empty. On a Saturday or a Sunday the junctions stay empty rings, since nothing was counted. Switch to bicycles and choose a season, and the three detectors grow with the hour on any day of the week.